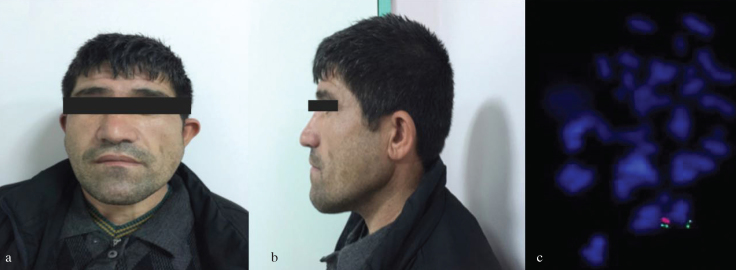
Figure 1. a–c.
Facial dysmorphism and FISH analysis of the patient. Facial asymmetry of the patient with a long face (a), Lateral view of the cup-shaped ear (b). FISH analysis of the patient using a LSI TUPLE 1 (DGS critical region) spectrum orange/LSI ARSA (control probe) spectrum green probe, the orange signal indicates deletion of the TUPLE 1 locus at 22q11.2 (c).

