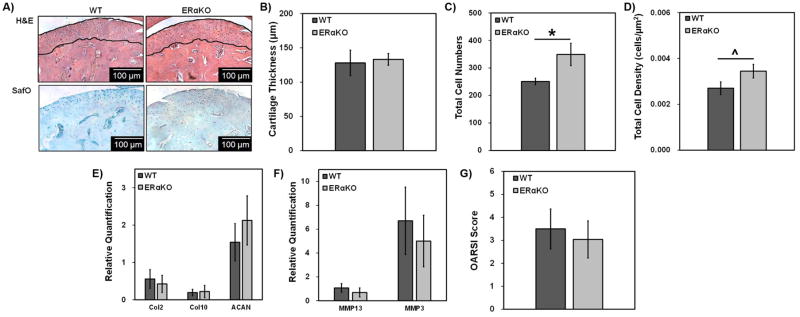
Figure 2. Histomorphometric, gene expression, and OARSI scoring analysis of 9-month WT and ERαKO male mandibular condylar cartilage.
Representative H&E and SafO images for WT and ERαKO samples (A). The lines highlight the cartilage region measured. Histomorphometric analysis was conducted using ImageJ to determine cartilage thickness (B), total cell numbers (C), and total cell density (D). Real time PCR analysis of chondrocyte-specific matrix genes (E) and MMPs (F). OARSI osteoarthritic scoring for WT and ERαKO 9-month mice (G). For histomorphometric and OARSI scoring data, WT n=5 and ERαKO n = 6 and *p < 0.05, ^p < 0.01. For gene expression data, WT n=6 and ERαKO n = 7 and *p < 0.05, ^p < 0.01.

