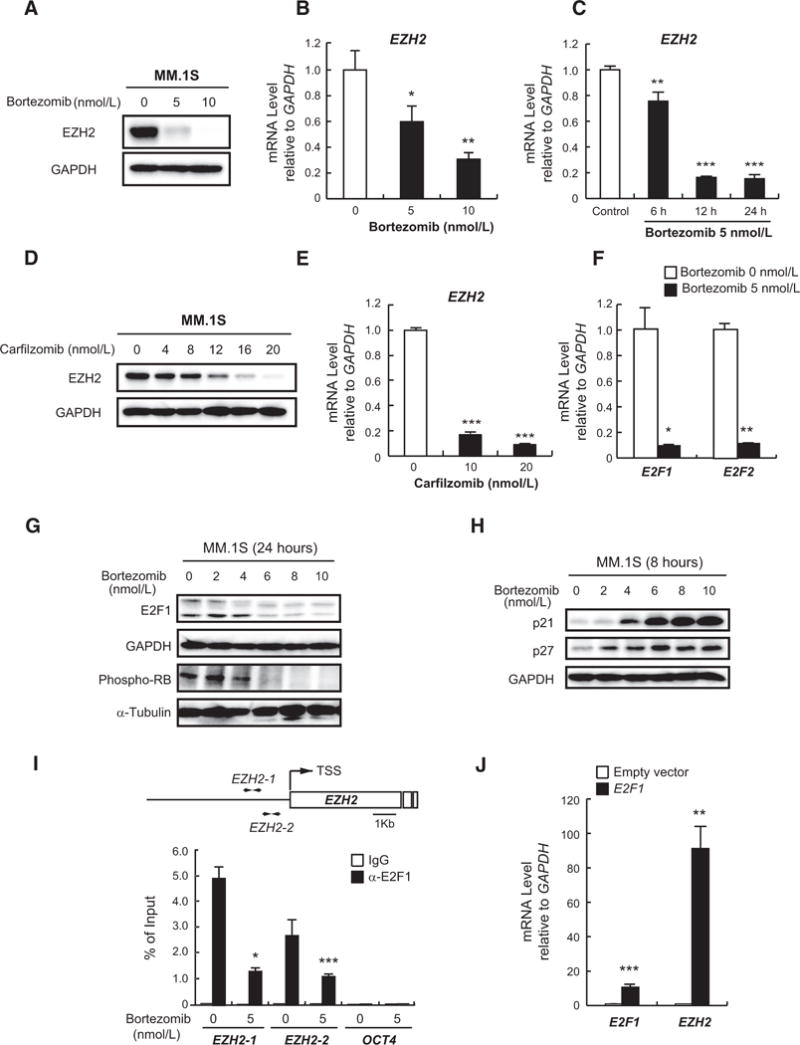
Figure 2.

Bortezomib down regulates EZH2 via E2F inactivation. A, Immunoblot analysis for EZH2 after treatment of MM.1S cells with the indicated concentrations of bortezomib for 24 hours. GAPDH served as a loading control. B and C, Quantitative RT-PCR analysis of EZH2 mRNA expression in MM.1S cells treated with the indicated doses of bortezomib for 8 hours (B) or 5 nmol/L of bortezomib for the indicated times (C). The y-axis represents fold-change after normalization to GAPDH, and error bars represent SD of triplicates. D, Immunoblot analysis of EZH2 in MM.1S cells treated with the indicated doses of carfilzomib for 24 hours. GAPDH served as a loading control. E, Quantitative RT-PCR analysis of EZH2 mRNA expression in MM.1S cells treated with the indicated doses of carfilzomib for 12 hours. The y-axis represents fold-change after normalization to GAPDH, and error bars represent SD of triplicates. F, Quantitative RT-PCR analysis of E2F1 and E2F2 mRNA expression in MM.1S cells treated with 5 nmol/L of bortezomib for 12 hours. The y-axis represents fold-change after normalization to GAPDH, and error bars represent SD of triplicates. G and H, Immunoblot analyses for the indicated proteins in MM.1S cells upon (G) 24-hour or (H) 8-hour treatment with a range of concentrations of bortezomib. GAPDH and α-tubulin served as loading controls. I, ChIP analysis for E2F1 occupancy on EZH2 promoter in MM.1S cells treated with 5 nmol/L of bortezomib or DMSO for 24 hours. OCT4 was used as a negative control. Values correspond to mean percentage of input enrichment ± SD of triplicate qPCR reactions of a single replicate. Schematic representation of the location of the primer sets is depicted (top). J, Quantitative RT-PCR analysis of mRNA expression of E2F1 and EZH2 in H929 cells transduced with E2F1-overexpressing or empty vectors. The y-axis represents fold-change after normalization to GAPDH, and error bars represent SD of triplicates.*, P < 0.05;**, P < 0.01; and***, P < 0.001.
