
Figure 4.
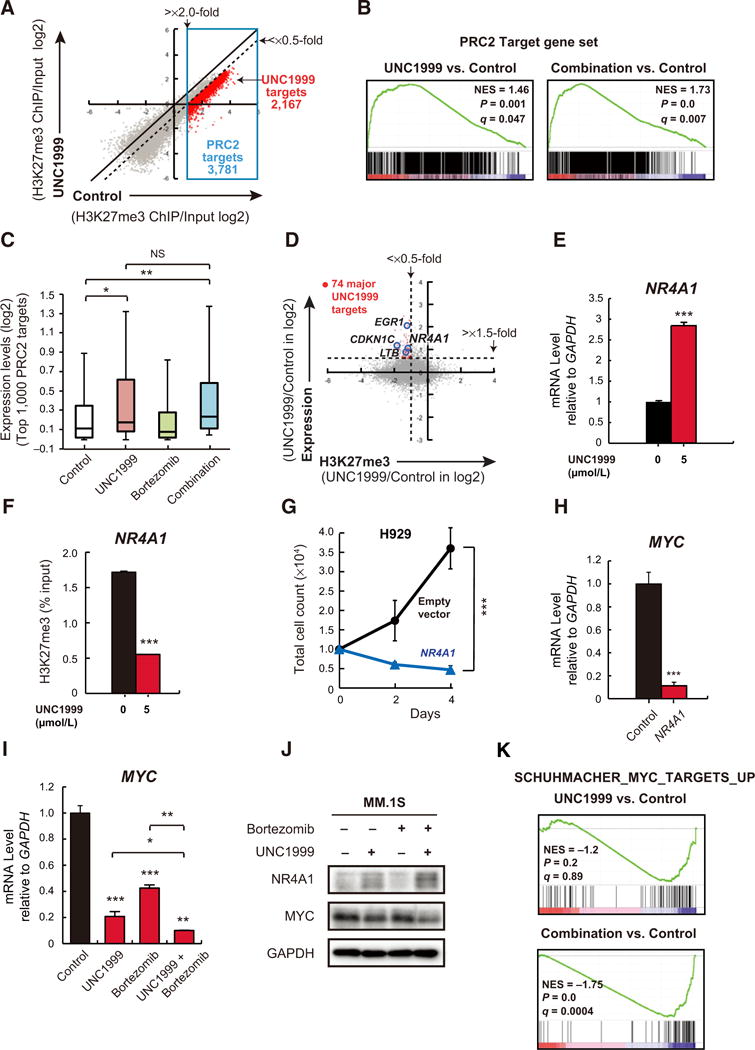
Identification of UNC1999-target genes in MM.1S cells. A, A scatter plot showing the correlation of the fold enrichment values (ChIP/input; TSS ± 2.0 kb) of H3K27me3 against the input signals of RefSeq genes between DMSO (control)- and UNC1999-treated MM.1S cells. Dotted diagonal line indicates 2-fold change. Blue box indicates PRC2 target genes (3,781 genes) with greater than 2-fold enrichment in H3K27me3 mark in the control. Red dots represent UNC1999 target genes with more than 2-fold reduction in H3K27me3 levels (2,167 genes). B, Gene set enrichment plots for PRC2 target genes defined in (A) in MM.1S cells treated with UNC1999 alone (left) and combination (right) versus DMSO-treated control cells. NES, normalized enrichment score; q, FDR q value; P, P value. C, Box-and-whisker plots showing the expression changes of the top 1,000 PRC2 target genes defined in (A) in DMSO-, UNC1999-, bortezomib-, and combination-treated MM.1S cells. Boxes represent 25 to 75 percentile ranges. Vertical lines represent 10 to 90 percentile ranges. Horizontal bars represent median. D, A scatter plot showing the correlation between the expression of genes and H3K27me3 levels in UNC1999- vs. DMSO-treated control MM.1S cells. Red dots indicate major UNC1999 target genes with significantly enhanced expression (>1.5-fold UNC1999/Control). Representative genes are highlighted. E, Quantitative RT-PCR analysis of NR4A1 mRNA expression in MM.1S cells following treatment with 5 μmol/L of UNC1999 for 72 hours. The y-axis represents fold-change after normalization to GAPDH, and error bars represent SD of triplicates. F, ChIP analysis for H3K27me3 occupancy loss in promoter regions (TSS ± 2 kb) of NR4A1 in MM.1S cells treated with 5 μmol/L of UNC1999 for 72 hours versus DMSO-treated cells. Values correspond to mean percentage of input enrichment ± SD of triplicate qPCR reactions of a single replicate. G, Cell proliferation assay of H929 cells (10,000 cells per well in 96-well plate) transduced with the indicated retroviruses for 48 hours prior to cell sorting for GFP expression. Cell counting was performed using Trypanblue atthe indicated times. The y-axis is presented as the mean cell number ± SD of quadruplicates. H, Quantitative RT-PCR analysis of MYC mRNA expression in H929 cells transduced with NR4A1-overexpressing or empty vectors. The y-axis represents fold-change after normalization to GAPDH, and error bars represent SD of triplicates. I, Quantitative RT-PCR analysis of MYC mRNA expression in MM.1S cells upon 72 hours of 5 μmol/L of UNC1999 and/or 5 nmol/L of bortezomib treatment for the last 12 hours. The y-axis represents fold-change after normalization to GAPDH, and error bars represent SD of triplicates. J, Immunoblot analysis for the indicated proteins in MM.1S cells upon 72 hours of 5 μmol/L of UNC1999 and/or 5 nmol/L of bortezomib treatment for the last 12 hours. GAPDH was used as a loading control. K, A representative MYC target gene set significantly enriched in MM.1S cells treated with UNC1999 alone (top) and combination (bottom) versus DMSO-treated cells. NES, normalized enrichment score; q, FDR q value; P, P value. *, P < 0.05; **, P < 0.01; and ***, P < 0.001.