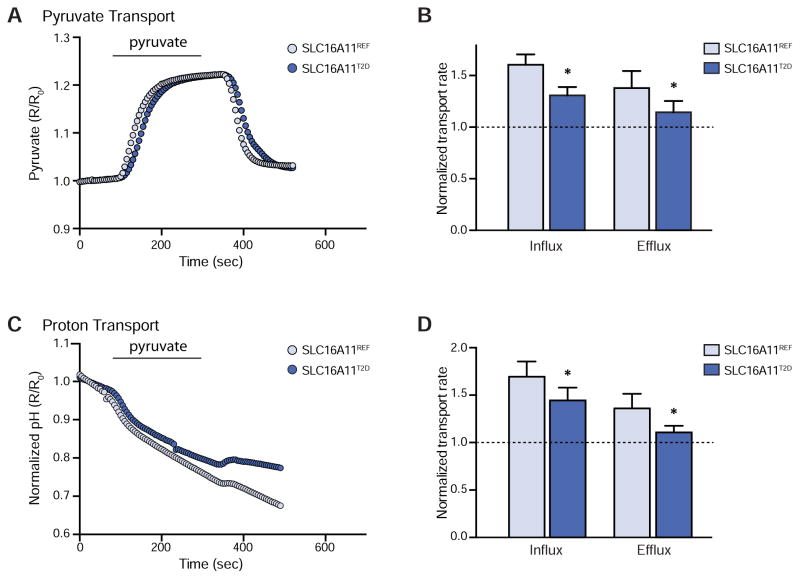
Figure 4. T2D risk-associated coding variants abrogate SLC16A11 activity.
(A–D) Assessment of pyruvate (pyronic) and proton (BCECF-AM) flux in HEK293T cells expressing either SLC16A11REF (light blue) or SLC16A11T2D (dark blue). Pyruvate (0.4 mM) was added and removed, as indicated. (A) Representative traces and (B) bar plots depicting normalized rates of pyruvate influx and efflux ± SEM. The rate of transport is normalized to empty vector control, which is indicated by the dashed line. * P < 0.05, n = 11. (C) Corresponding representative traces and (D) bar plots depicting normalized rates of proton influx and efflux ± SEM. * P < 0.05, n = 11. See also Figure S3.

