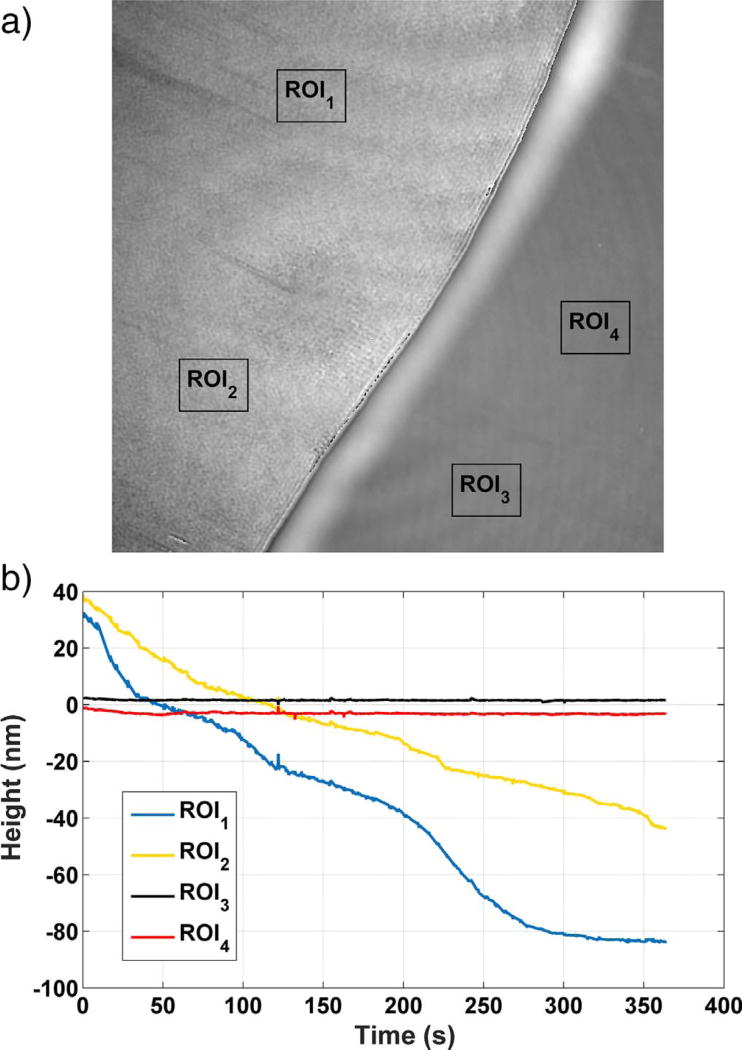
Fig. 1.
(a) A phase map of a gypsum surface at the start of an experiment, showing the chromium mask on the right and the gypsum (010) surface on the left. (b) Time dependence of the height in two regions of interest (ROIs) marked on the gypsum surface as ROI1 and ROI2, and of two regions on the chromium mask marked as ROI3 and ROI4. Each of the ROIs has edge dimensions of 10 µm. Uncertainty in the individual height measurements along a profile is characterized by the temporal standard deviation of the measurement on a single pixel, 2 nm.

