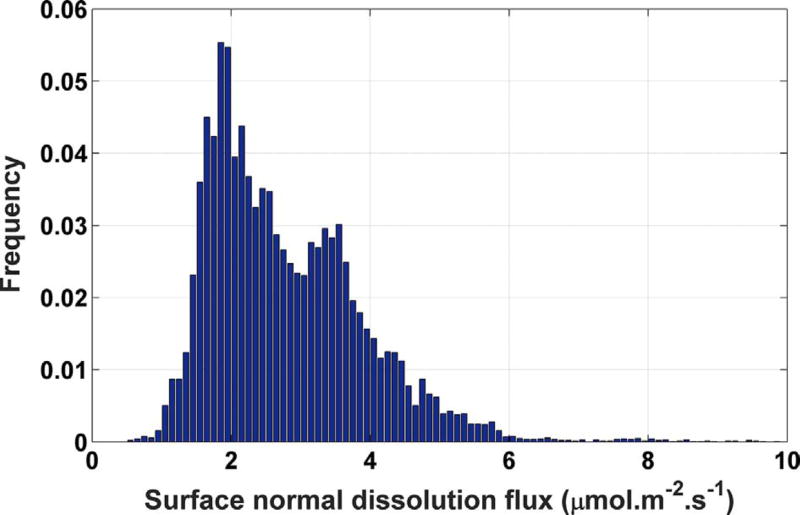
Fig. 10.
Histogram of dissolution fluxes collected from all seven crystals when no tall cleavage steps are observed during the experiment. The maximum uncertainty in the distribution at any point is about 0.45%, characterized as one standard deviation in Monte Carlo propagation of uncertainties in identical measurements made on calcite (104) cleavage surfaces (Brand et al., 2017).

