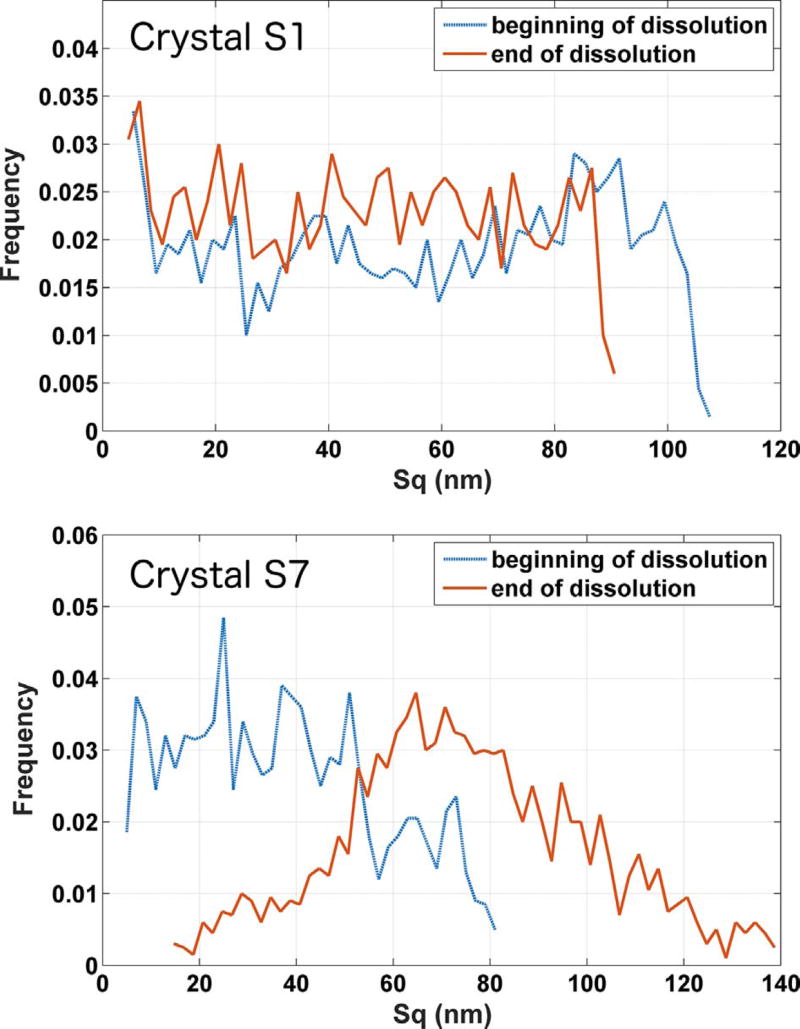
Fig. 12.
Distribution of local roughness Sq at the beginning and end of the observation period for crystal S1 (top), with one of the lower grand dissolution rates, and S7 (bottom), with the highest grand dissolution rate. The length scale used for roughness measurements is 10 µηι. The uncertainty in the individual measurements is characterized as the temporal standard deviation of the measurement on a single pixel, 2 nm. (For interpretation of the references to color in this figure, the reader is referred to the web version of this article.)

