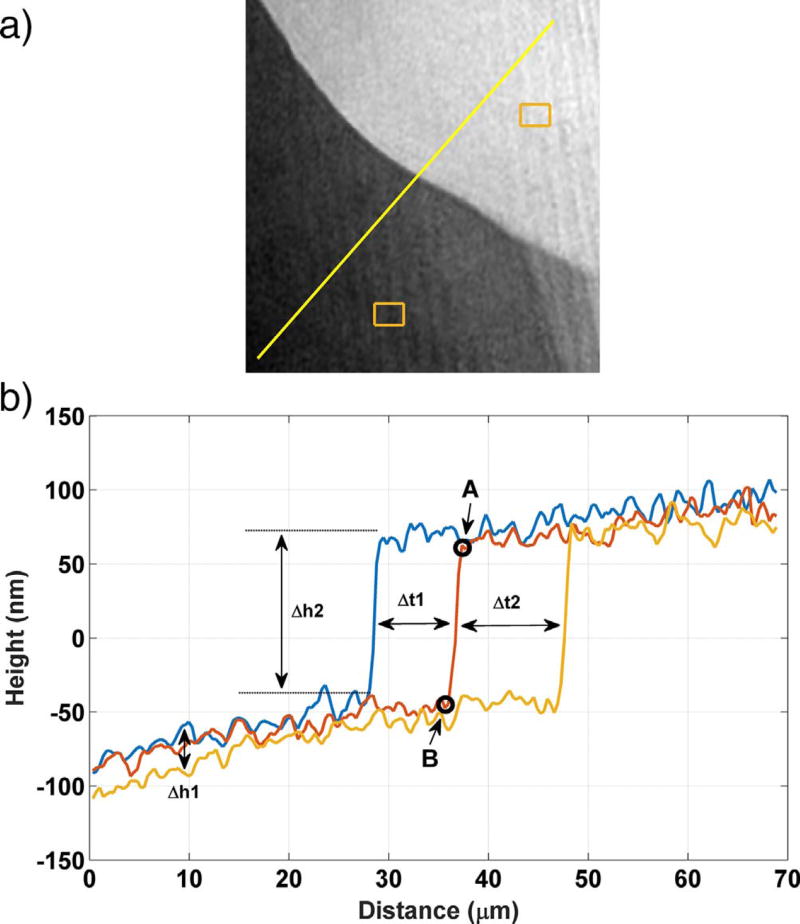
Fig. 15.
1D profiles over 25 s showing stepwave motion parallel to [100] on the (010) gypsum cleavage surface of sample A. The uncertainty in the individual measurements is characterized as the temporal standard deviation of the measurement on a single pixel, 2nm. (For interpretation of the references to color in this figure, the reader is referred to the web version of this article.)

