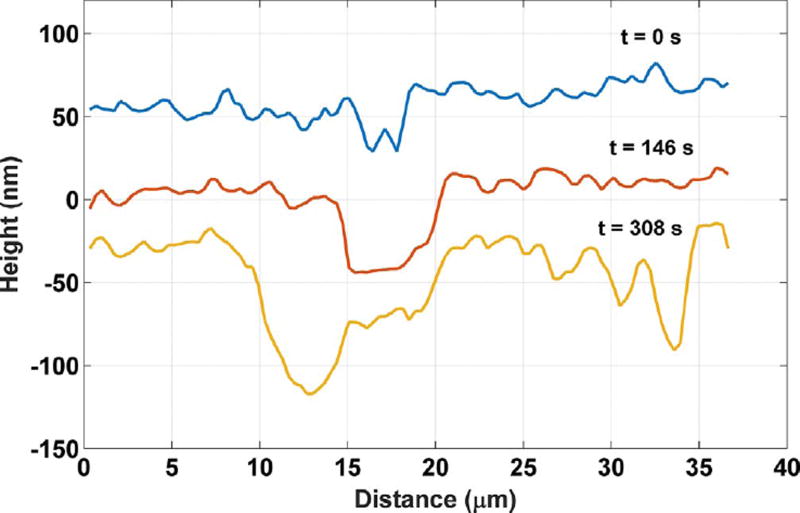
Fig. 7.
Etch pit cross section profile defined by the red line segment in Fig. 6. The uncertainty in the individual measurements along the profile is characterized as the temporal standard deviation of the measurement on a single pixel, 2 nm. (For interpretation of the references to color in this figure legend, the reader is referred to the web version of this article.)

