Figure 2.
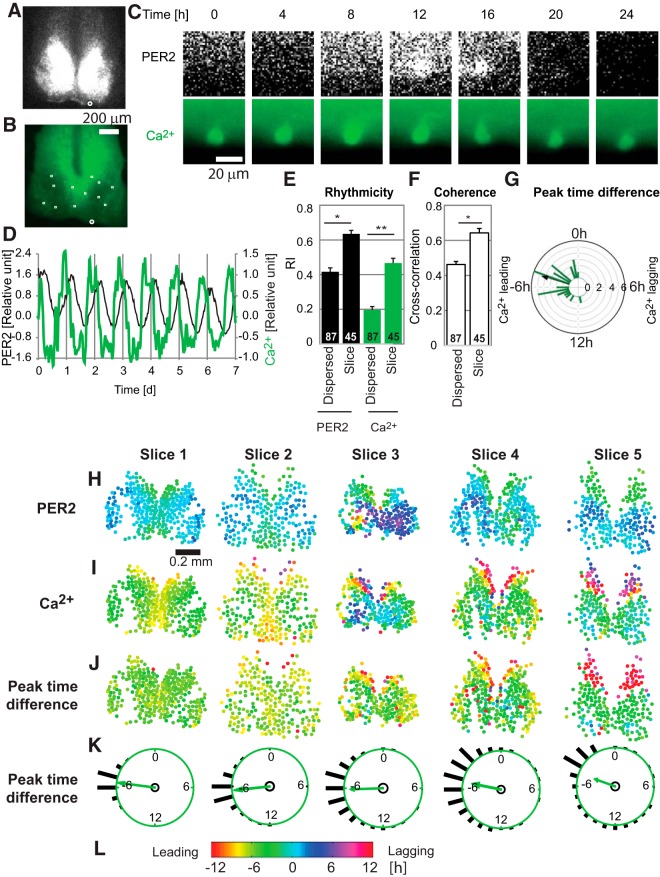
PER2 and [Ca2+]i dynamics of single neurons in SCN slices. Representative images of PER2 (A) and [Ca2+]i (B) in an SCN slice. Positions of cells selected for data analysis were marked by white squares and a circle. C, Time-lapse images (at 4-h intervals) for the 50 × 50-µm area marked by the white circle in A and B. Time 0 is 3.7 d after start of imaging. D, Representative patterns of PER2 (black lines, left axis) and [Ca2+]i (green lines, right axis) for a single cell within an SCN slice, showing clear PER2 and [Ca2+]i rhythms. Time 0 is start of imaging. E, F, Comparisons of single SCN neurons in dispersed versus slice cultures, showing PER2 and [Ca2+]i rhythmicity (RI) (E) and coherence between PER2 and [Ca2+]i rhythms (F). Values are averages ± SEM, with numbers of cells shown on bars. *, p < 0.05; **, p < 0.01, mixed effect model. G, Rayleigh histogram showing the distribution of differences between PER2 and [Ca2+]i peak times for individual cells in SCN slices. Negative or positive values indicate that [Ca2+]i peak is leading or lagging PER2 peak, respectively. Length of bars indicates number of cells within each 1-h bin (n = 32 cells in three slices). Arrow indicates a mean vector. H–L, Spatiotemporal relationships between PER2 and [Ca2+]i peaks of five SCN slices. H, I, For each of the five slices, cell-like regions with significant rhythmicity in both PER2 and [Ca2+]i are plotted as circles, with peak phases color-coded as in L. PER2 (H) or [Ca2+]i (I) peak times are shown relative to the PER2 peak time of the whole slice, with negative values indicating phase leading of cell-like regions. J, Peak time differences between PER2 and [Ca2+]i are also shown, color-coded as in L. Negative values indicating phase leading of [Ca2+]i peaks relative to PER2 peaks in the same cell-like regions. K, Rayleigh histograms show corresponding distributions of these peak time differences. Numbers of cell-like regions: 267, 238, 149, 331, and 179 in slices 1–5, respectively. Bar length indicates the proportion of cells in each bin. Arrows indicate mean vectors, all of which extend outside the small inner circles marking criterion levels for statistical significance (Rayleigh test, p < 0.01), indicating that the distributions are all significantly different from uniform.

