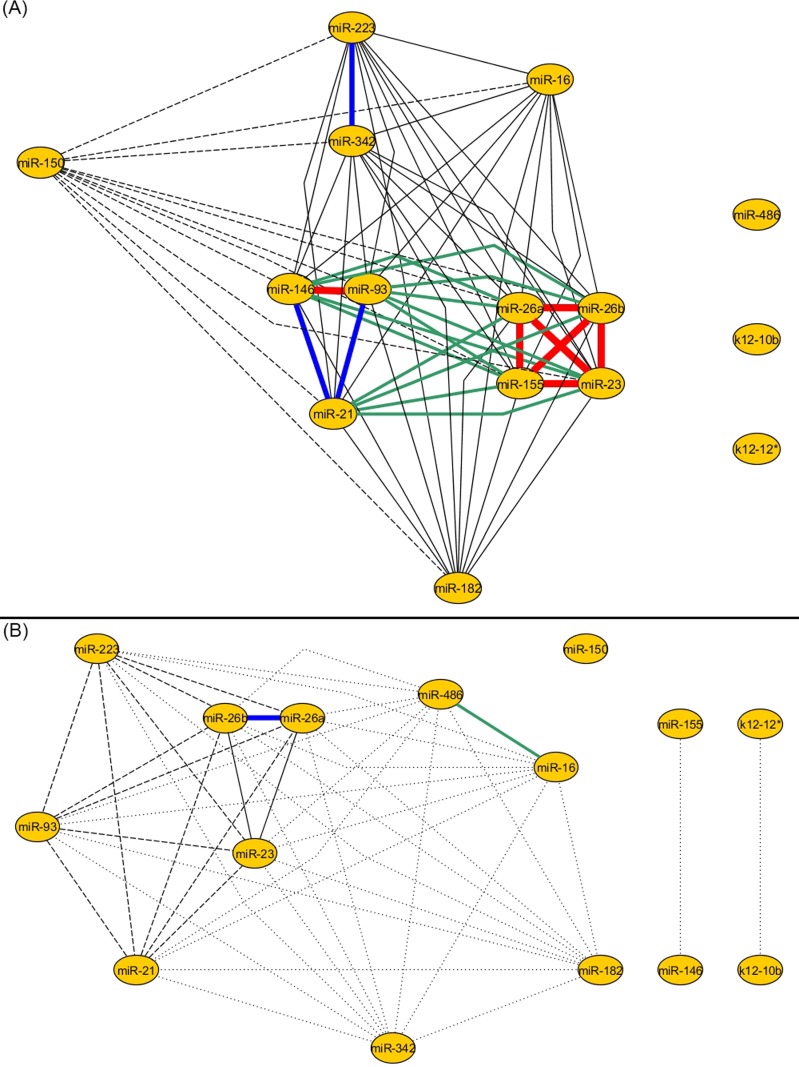
Fig 2. The miRNA networks for control and septic patients built using cluster analysis.
The number of edges decreases between the control (A) and septic network (B), from 66 to 47; this means a decrease of 28.79% (statistically significant, P = 0.0125, the strength of connection between two miRNAs is represented using a color legend, for more details see S2 Table). Furthermore, the strength of the connections decreases significantly, the total distance between the nodes of the control group is 1595 and the total distance between the nodes of the sepsis group is 7370, P = 0.0001. Again, the viral miRNAs are isolated from the control and septic patient network.

