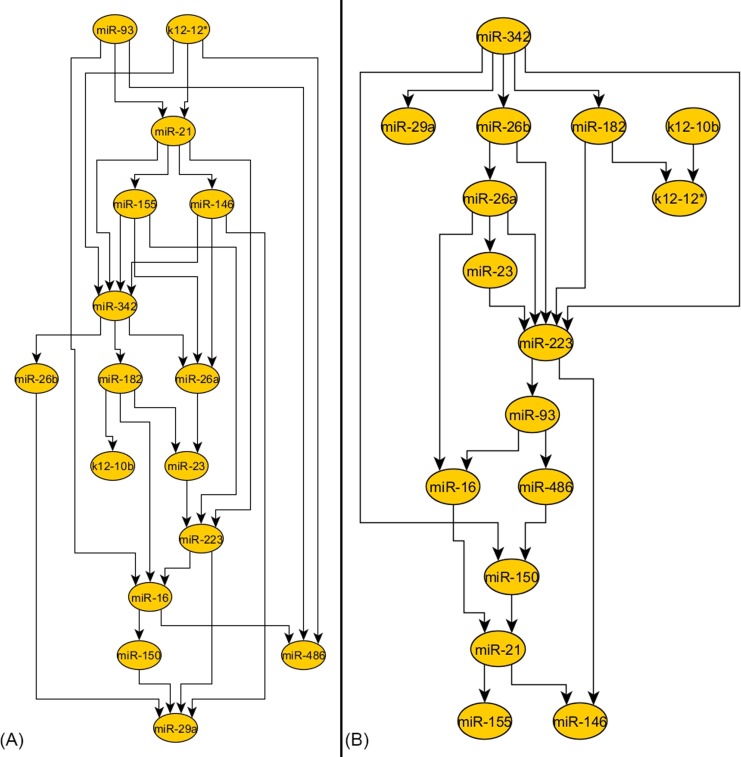
Fig 3. The miRNA networks for control and septic patients built using Bayesian inference.
On the left side the control group network is depicted (A) and, on the right side the septic patient network is shown (B). The number of edges decreases between the two networks, from 30 edges in the control group to 23 edges in the septic group, which means a decrease of 23.33% (not statistically significant, P = 0.3505). In both, control and septic patient network, the same miRNAs remain very well connected (miR-21, miR-223 and miR-342). The viral miRNAs are connected to the networks in both cases, but their connection is weak.

