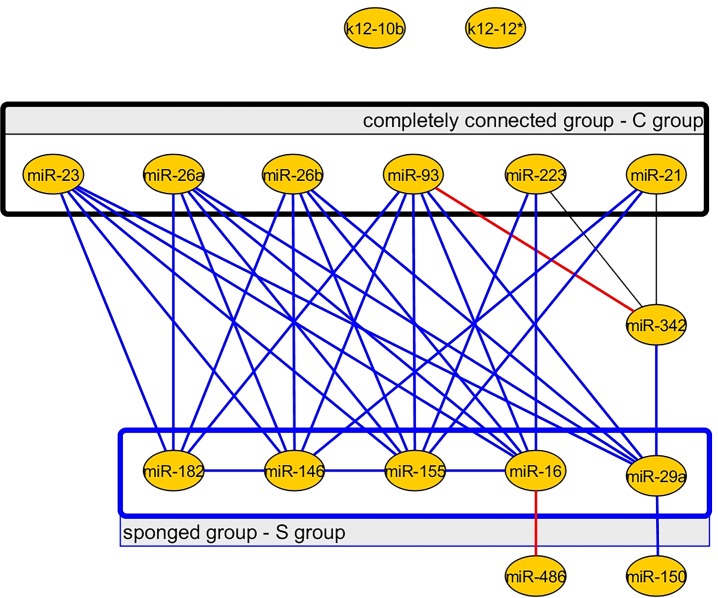
Fig 5. The miRNA network representing all the edges that remain both in control and sepsis, newly appear and disappear in sepsis, when using the correlation coefficient method.
The edges that remain both in control and sepsis are represented by the black lines, the edges that disappear in sepsis are represented by blue lines and the two new edges that appear in sepsis are represented by red lines. New edges appear between miR-93 and miR-342 and between miR-16 and miR-486. The C group is a completely connected group both in control and sepsis (black rectangle). The C group is composed of six miRNAs–miR-23, miR-26a, miR-26b, miR-93, miR-223 and miR-21. The S group (blue rectangle) is a group of miRNAs that is highly connected in the control patient network, but loses all of its connections in sepsis. In sepsis, the internal connections of the S group (blue rectangle) and the connections between the S and C groups are lost.

