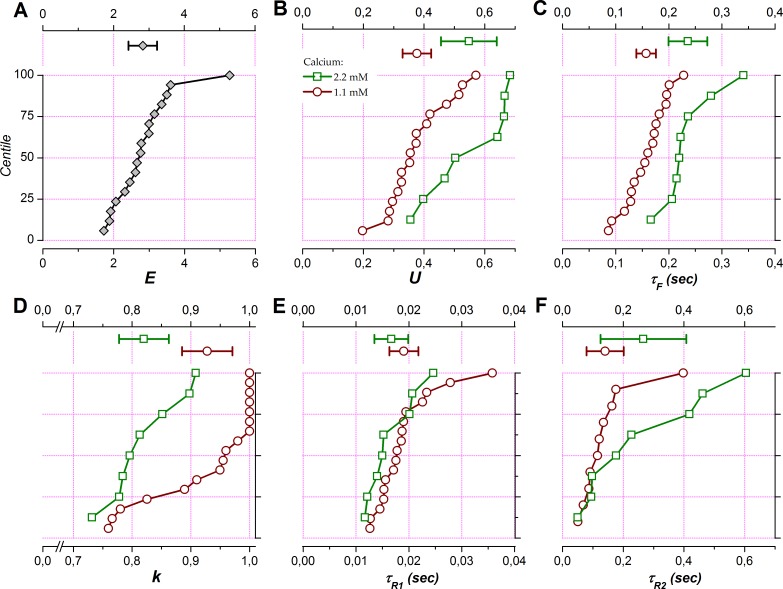
Fig 6. Short-term plasticity parameters at population levels with 1.1 and 2.2 mM calcium.
Parameters optimized to fit the observed STP data are summarized as means and 95% confidence intervals (upper part in each panel) and as cumulative distributions (centile plots, lower part in each panel) for data obtained in 1.1 mM (red circles) and 2.2 mM calcium (green squares). The dashed line at 50% in the centile plots indicates the median of the distributions and lines at 25% and 75% delineate the interquartile range. A: E, efficacy. B: U, utilization of efficacy on a single stimulation at rest (fully recovered and non-facilitating). C: τF, time constant of facilitation. D: k, coefficient defining the partition of synaptic resources in two subgroups subjected to different time courses of recovery from depression. E: τR1, time constant of recovery for fast depression. F: τR2, recovery time constant of recovery for slow depression.

