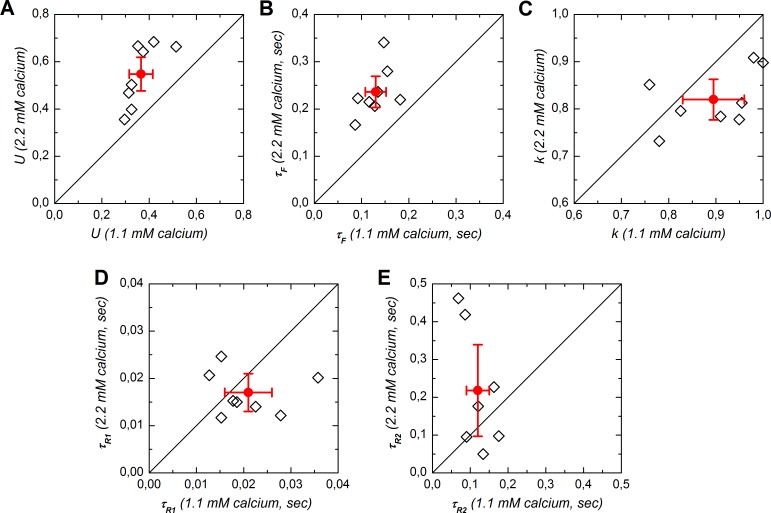
Fig 7. Scatter plot of short-term plasticity parameters for experiments performed with both 1.1 and 2.2 mM calcium (n = 8).
A: U, utilization of efficacy on a single stimulation at rest (fully recovered and non-facilitating). B: τF, time constant of facilitation. C: k, partition of synaptic resources. D: τR1, time constant of recovery for fast depression. E: τR2, recovery time constant for slow depression. Diagonal lines represent equality lines. Open symbols correspond to individual experiments, plain symbols represent the mean for the subsample of experiments in which STP was tested in both 1.1 and 2.2 mM calcium, associated bars correspond to the 95% confidence intervals.

