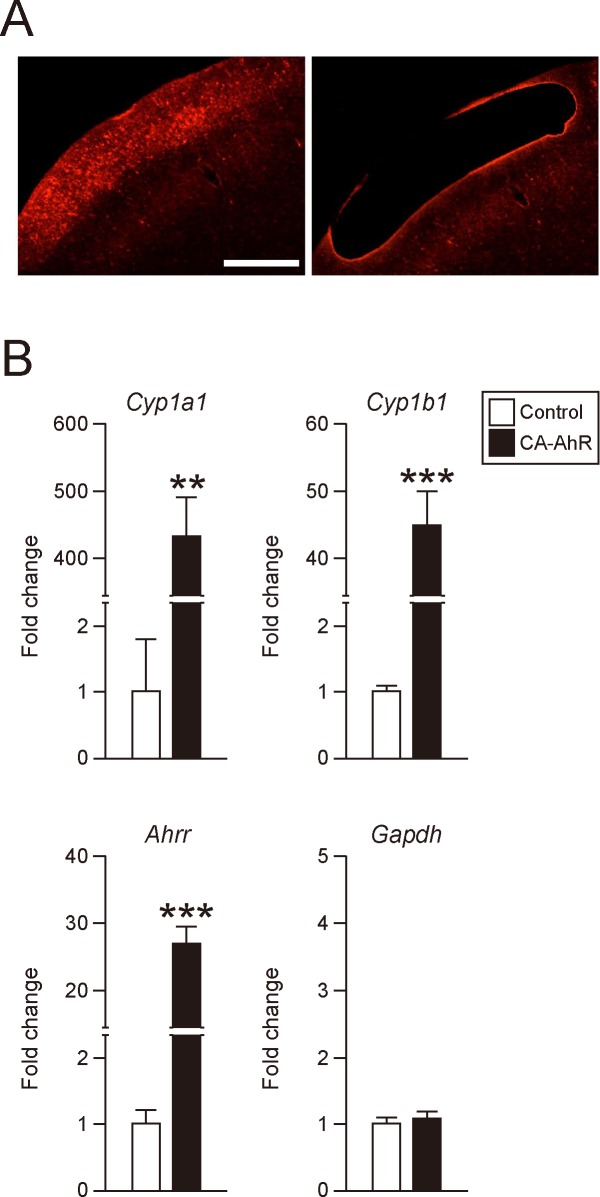
Fig 5. Expression analysis of AhR target genes in tdTomato-transfected cerebral cortex.
(A) Representative photographs of cerebral cortex section before (left) and after (right) microdissection of the tdTomato-positive area. Scale bar = 500 μm. (B) Quantitative real-time RT-PCR analysis of Cyp1a1, Cyp1b1, Ahr repressor (Ahrr), and Gapdh mRNA expression levels in the tdTomato-positive area. Quantitative fold changes were normalized to 18S rRNA expression levels. Values are mean ± S.E.M. from 3 control and 5 CA-AhR group mice. Asterisks (** and ***) denote significant differences by Student’s t-test at p < 0.01 and 0.001, respectively.

