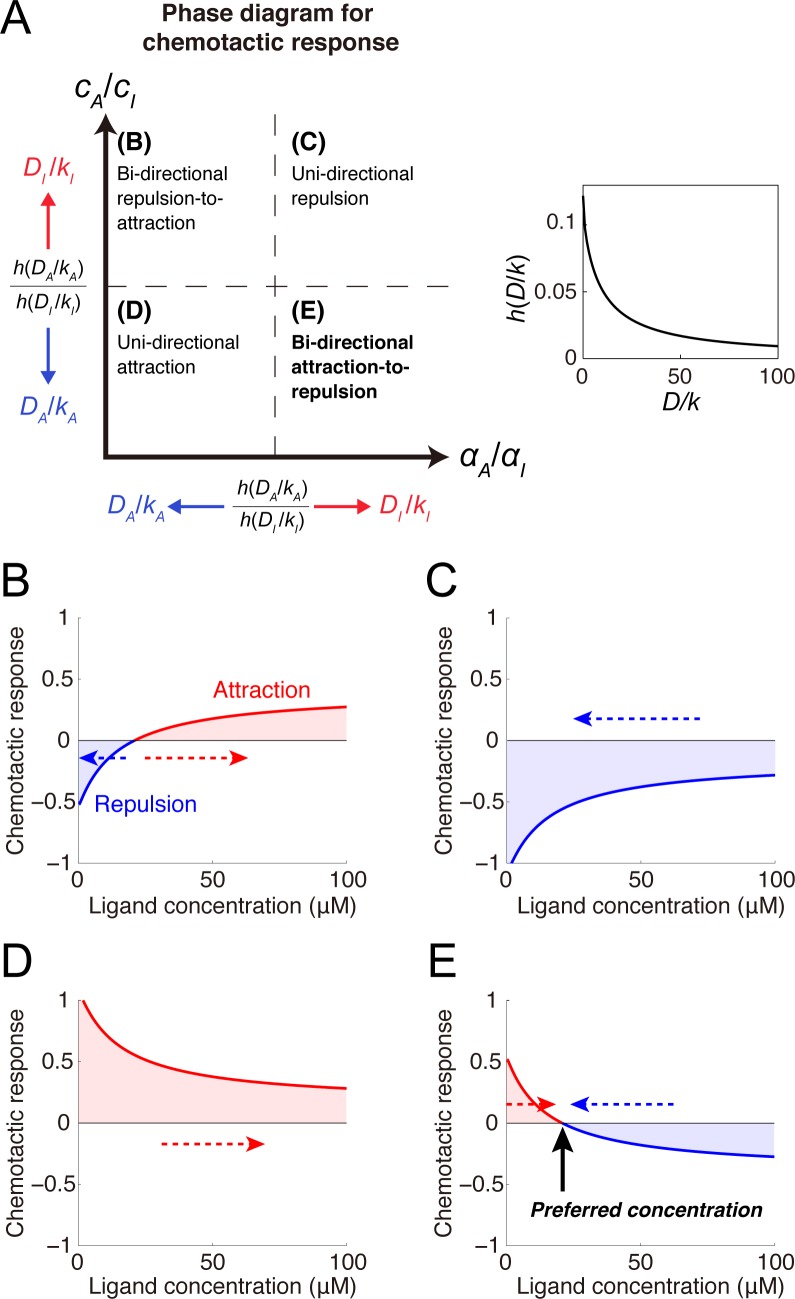
Fig 3. Mechanism of ligand concentration preferences by switching attraction and repulsion.
(A) Phase diagram depicting parameter regions of the four chemotactic response patterns. The dashed lines indicate critical lines corresponding to a ratio of h(DA/kA) to h(DI/kI). Because h(D/k) is a monotonically decreasing function of D/k (inset), the critical lines move with changes in DA/kA and DI/kI. (B-E) Various chemotactic responses (i.e., ΔE/E*) to guidance cue concentrations were derived: (B) bidirectional repulsion-to-attraction, (C) unidirectional repulsion, (D) unidirectional attraction and (E) bidirectional attraction-to-repulsion (BAR). Dashed arrows indicate the direction of concentration changes resulting from attractive or repulsive migration. In the BAR response, the x-intercept indicated by the black arrow corresponds to the preferred guidance cue concentration. The model parameters are listed in Table 1.

