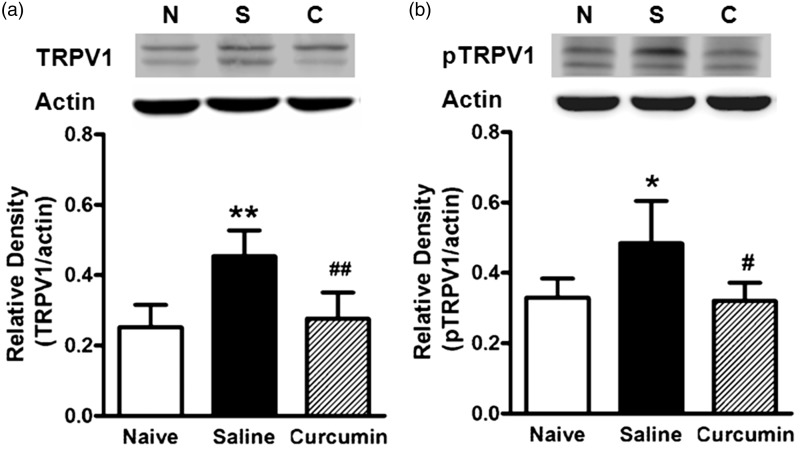
Figure 3.
The effects of curcumin on DSS-induced upregulation of TRPV1 (a) and pTRPV1 (b) in colon. (a) and (b) top: The examples of TRPV1 and pTRPV1 (MW: 98 KDa) expression in colon from naive (N: normal control), saline (S: DSS + saline), and curcumin (C: DSS + curcumin) groups. (a) and (b) bottom: The protein level of either TRPV1 or pTRPV1 was apparently higher in DSS + saline group than that in normal control group (**P < 0.01, *P < 0.05, one-way ANOVA with Bonferroni’s posttest). The protein level of either TRPV1 or pTRPV1 was much less in curcumin treatment group than that in saline treatment group (##P < 0.01, #P < 0.05, one-way ANOVA with Bonferroni’s posttest). n = 5–6 rats/group.

