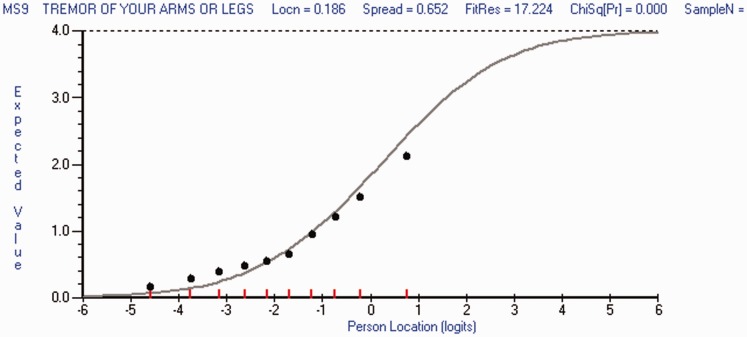
Figure 2.
Exemplar item characteristic curve (ICC).
The ICC plots the scores expected by the Rasch model for each individual item on the y-axis at each and every level of the measurement continuum of Physical Impact (x-axis). The black dots represent observed scores in each of the 10 class intervals of the trait (i.e. Physical Impact). This ICC for Item 9 indicates slight under-discrimination of the trait, as the line indicated by the dots is flatter than the expected curve. Individuals with higher impact (right hand-side of the continuum) scored lower than expected denoting lower impact, while patients with lower impact (left hand-side of the continuum) scored higher than expected denoting more impact.

