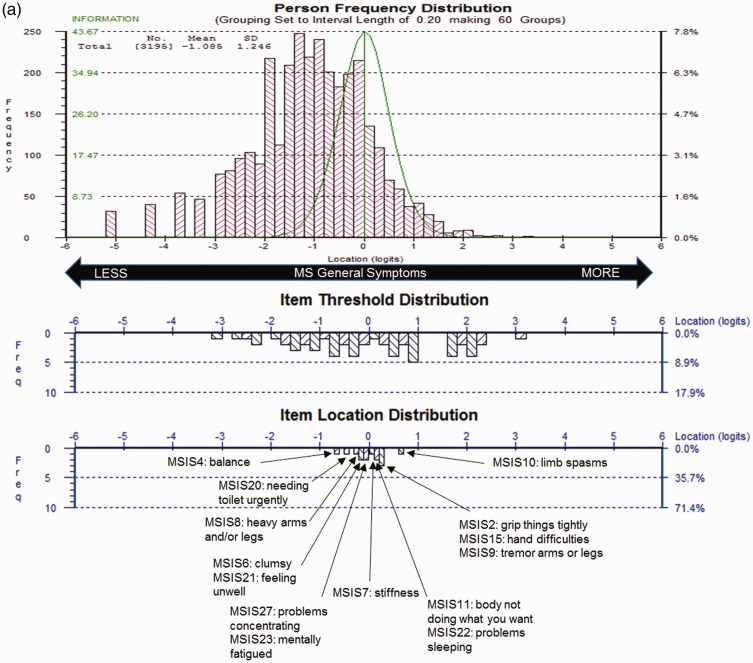
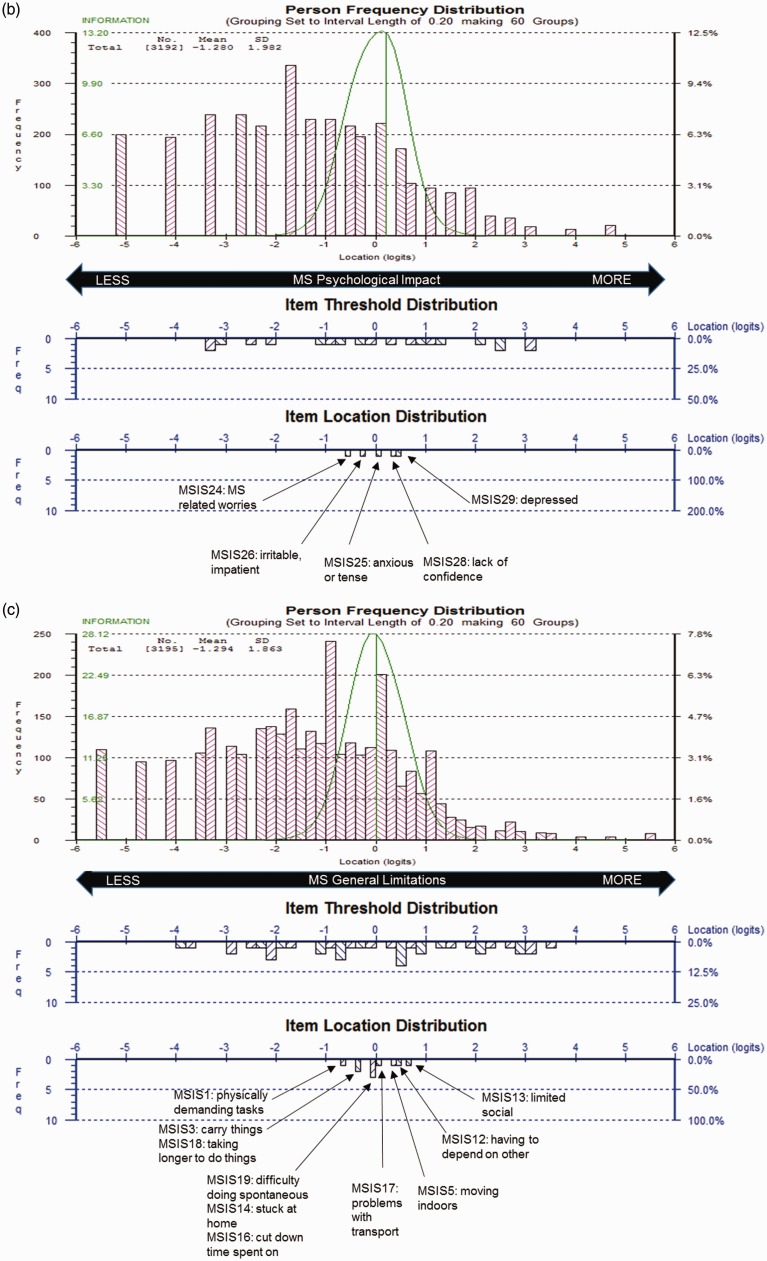
Figure 4.
Revised Multiple Sclerosis Impact Scale (MSIS-29) sample-to-scale targeting.
The top pink histogram shows the distribution of General Symptoms (a), Psychological Impact (b) and General Limitation (c) in the sample and the lower blue histogram shows the distribution of impact in the MSIS-29 scale item thresholds and mean item locations, which map out the 14 (a), 5 (b) and 10 (c) items.


