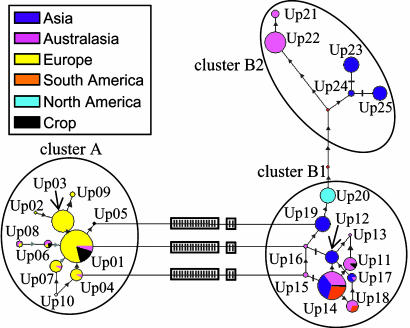
Fig. 2.
Haplotypic network and regional distribution of the 25 U. pinnatifida mtDNA haplotypes. Circle sizes are proportional to the number of individuals observed for each haplotype, and color pie charts indicate the distribution of the haplotype among wild populations in the five world-wide regions and crops. Connecting lines show mutational pathways among haplotypes; triangles represent single-site substitutions; perpendicular bars, indels; and boxed bars, blocks of 16 and 2 tandem indels. Unlabeled red nodes indicate inferred steps not found in the sampled populations. Clusters group closely related haplotypes.

