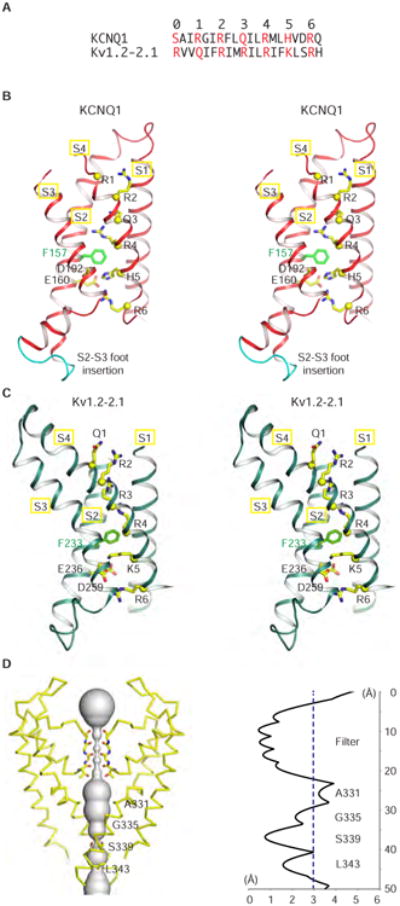
Figure 2. The activated voltage senor and closed pore.

(A) Sequence alignment of S4 for KCNQ1EM and Kv1.2-2.1.
(B-C) Stereoview of the voltage sensors of KCNQ1EM and Kv1.2-2.1 (PDB: 2R9R). Only the helical regions of S1-S4 are shown for clarity. The c-alphas of the positive charged (or polar) resides on S4 are shown in yellow spheres with stick side chains, and the gating charge transfer center residues F157/F233 (green), E160/E236 (yellow) and D192/D259 (yellow) are shown as sticks. The nine amino acid insertion in KCNQ1 S2-S3 ‘foot’ is colored in cyan in (B).
(D) Left, view of the KCNQ1EM pore with front and back subunits excluded for clarity. Right, radius of the pore calculated using HOLE program. The amino acids facing the pore are labeled.
