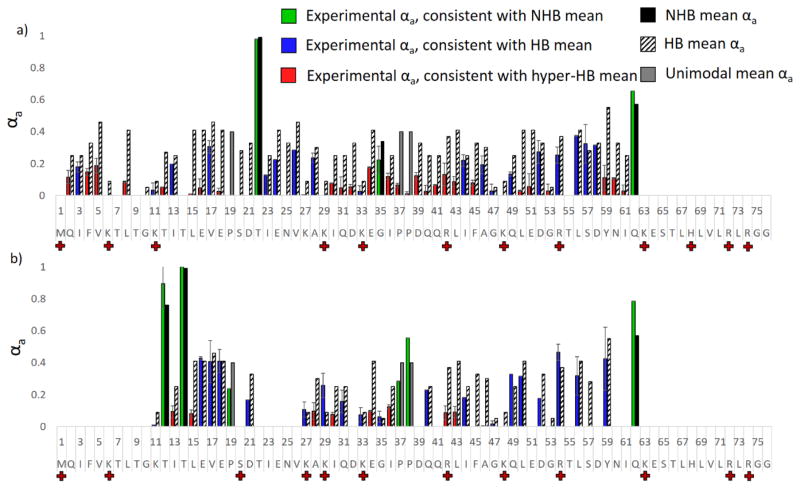
Figure 9.
UVPD-HEM of a) conformer A and b) conformer B of the 12+ charge state of ubiquitin, using the split charge states of the a ions to differentiate isomers A and B. Experimental αa values are shown in a) in green/blue/red for conformers A and B, and the HB and NHB means associated with cleavage at a given residue are shown in striped and solid black bars, respectively. Experimental bars are colored green for those that agree with the NHB mean, blue for those that agree with the HB mean, and red for those that agree with the hyper-HB mean (extremely strong hydrogen-bonding). Grey bars denote mean αa values for which only unimodal trends were previously observed.

