
Figure 6.
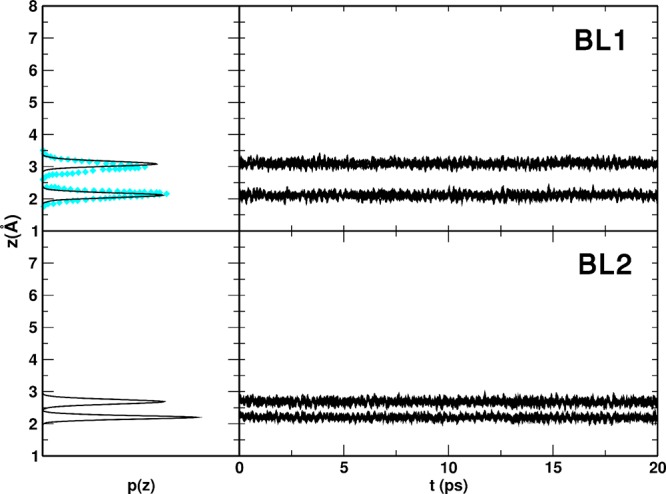
MATORG+HBD distribution p(z) and time evolution z(t) of the distances between the water molecules (O atoms) of the two water bilayer configurations, defined in Figure 5, and the titania surface (Ti5c atoms). The DFT Car–Parrinello corresponding distribution p(z) for BL1 (top panel) is reported in cyan diamonds.14