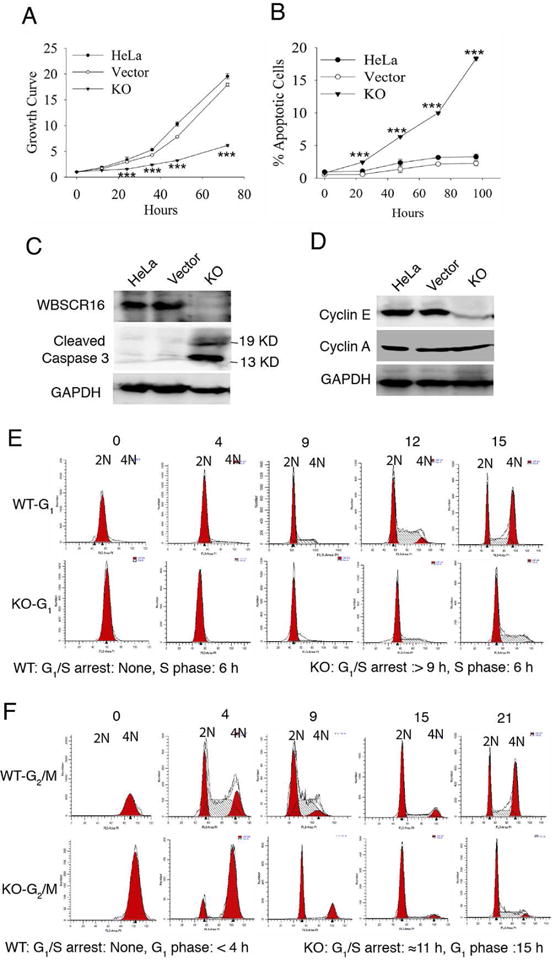
Figure 3. WBSCR16 knockout leads to markedly decreased cell growth, increased apoptosis, decreased cyclin E levels and blockage at the G1-S transition.

(A) MTT assay growth curves for untransfected HeLa cells, empty vector-transfected HeLa cells, or CRISPR-Cas9 WBSCR16 knockout (KO) HeLa cells. Ordinate axis: 1 is OD at time 0, with increasing numbers denoting fold increases thereafter. (B) FACS analysis shows increased apoptotic cells (sub-G1 DNA content) upon WBSCR16 CRISPR/Cas9 knockout. ***, P<0.005. Immunoblots show (C) increased cleaved caspase 3 and (D) reduced cyclin E in WBSCR16 CRISPR/Cas9 KO cells, compared with untransfected cells and cells transfected with empty vector. GAPDH, loading control. Cyclin A, additional loading control in D, showing cyclin E effects to be specific. (E) G1-phase HeLa cells, transfected with empty vector (WT) entered S-phase immediately. In contrast, G1-phase HeLa cells subjected to CRISPR-Cas9 WBSCR16 KO took at least 9 h to enter S-phase, with some entering after 12 h (blocked 9–12 h at the G1-S transition). Once in S, both WT and KO cells took 6 h to enter G2/M. (F) Both WT and WBSCR16-KO G2/M-phase cells entered G1-phase immediately. WT cells then transitioned quickly to S after G1, but KO cells were blocked in G1 for ~11 h, entering G1 only at the 15-h time point. Thus, experiments with G1-phase (E) and G2/M-phase (F) cells both indicate a block at G1-S transition in consequence of WBSCR16 ablation. See also Table S1.
