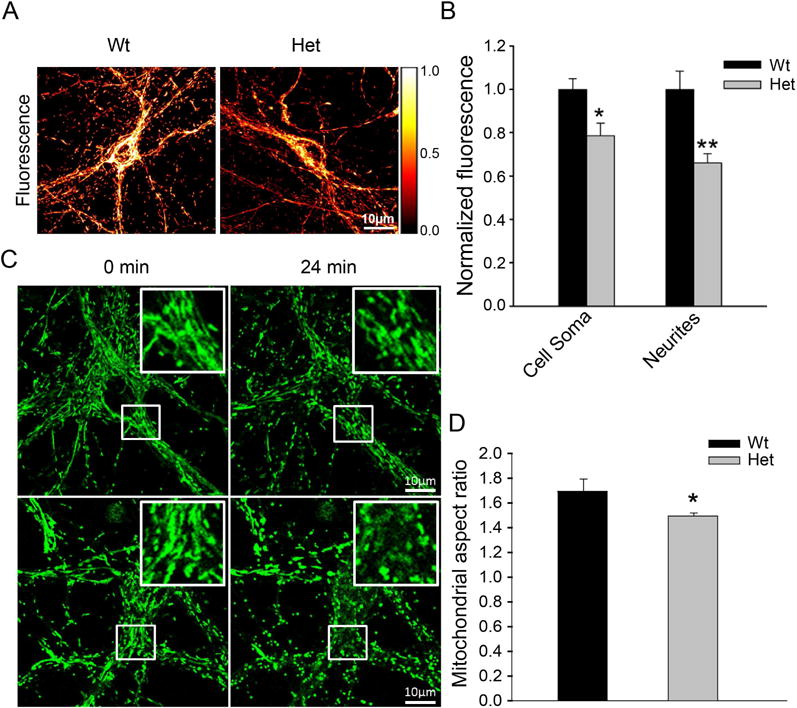
Figure 7. Wbscr16 heterozygous mutant neurons have reduced membrane potential and increased fragmentation in response to glutamate excitotoxicity.

Representative images (A) and quantitative analysis (B) of fluorescence intensity of wild type (WT) and heterozygous mutant Wbscr16 (Het) neuronal cell soma and neurites, on 12–14 day in vitro, incubated with potentiometric dye TMRM. In panel A, a pseudocolor intensity scale represents white as maximum and black as lowest intensities. For quantitative analysis (B), N=32 and 40 for WT and Het, respectively, from 3 experiments. *, P<0.05; **, P<0.01. (C) Mitochondria in WT and Het neurons were labeled with MitoTracker Green and imaged for morphology before and after 50 μM glutamate exposure. Representative images show WT and Het neurons before (0 min) and 24 min after glutamate exposure. Inserts: enlarged images of boxed regions of neuronal cell soma. Scale bars 10 μm. (D) Quantification is shown for neuronal mitochondrial aspect ratios for WT (n=7) and Het (n=9), upon glutamate exposure. Data obtained from 5 different experiments. *, P<0.05 (P=0.017).
