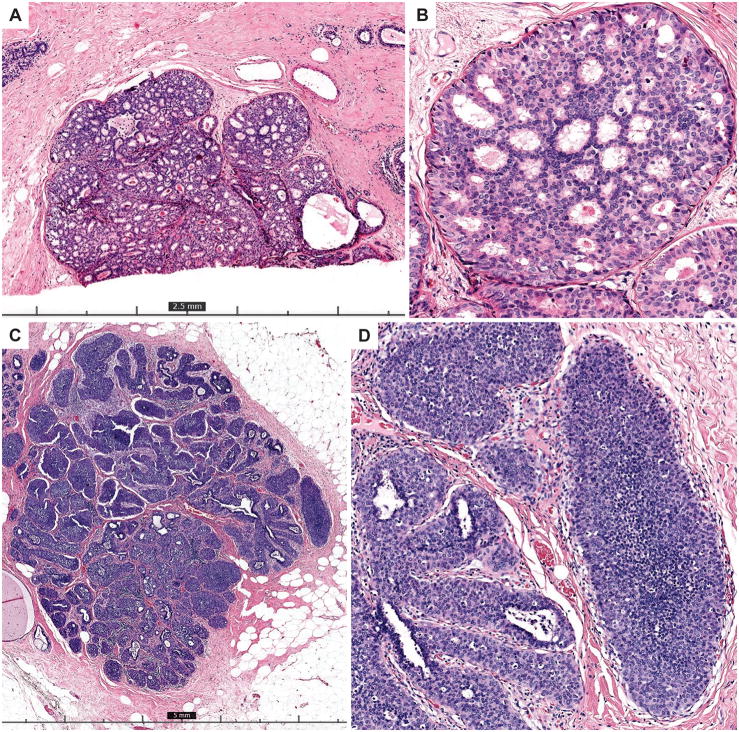
Figure 2.
A–B) The top two panels show 4x (A) and 20x (B) images from a case of consensus low-grade DCIS that had one of the highest diagnostic agreement rates (66%). This case has uniform involvement of ducts by a proliferation that has clear cytologic monotony and cribriform architecture with polarized spaces, characteristic of low grade DCIS. It measures just over 2 mm (a size threshold frequently used for a low-grade DCIS diagnosis) and is cut across at the edge of the slide. The majority of participants who did not record a low-grade DCIS diagnosis recorded a highest order diagnosis of ADH (29%) or lobular in situ neoplasia (21%) for the case. C–D) The bottom two panels show 2x (C) and 10x (D) images of a case with only 28% diagnostic agreement with the consensus diagnosis of low-grade DCIS. The majority of participants who did not make this diagnosis recorded a highest order diagnosis of LCIS. The solid growth pattern and low grade monotony present can be seen in either of these diagnostic entities. An E-cadherin stain (which was not available to participants) could help resolve this differential in clinical practice.

