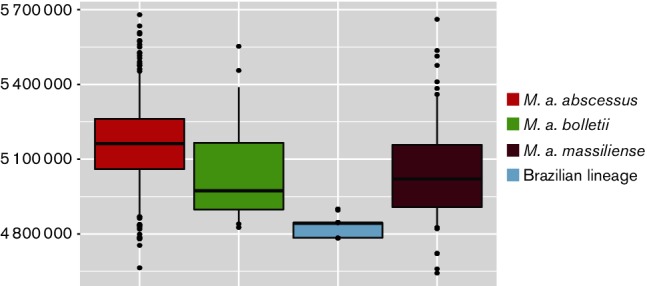
Fig. 5.

Boxplots comparing the genome sizes of 352 M . a. abscessus genomes, 30 M . a. bolletii genomes, 130 M . a. massiliense genomes and 188 Brazilian lineage genomes. The borders of the boxplot represent the 25th and 75th percentile. The bold line represents the median genome size. The whiskers mark the 5th and 95th percentile. This shows that the genome size of the Brazilian lineage (light blue) is significantly smaller than the genome sizes of the three subspecies.
