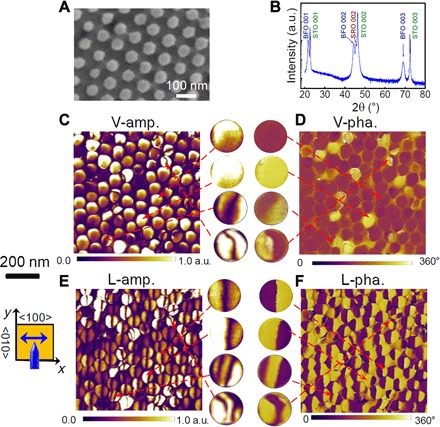
Fig. 1. Structure and PFM images for a BFO nanodot array.

(A) SEM image. (B) XRD pattern. STO, (001)-oriented SrTiO3; SRO, SrRuO3; a.u., arbitrary units. (C and D) Vertical PFM amplitude (V-amp.) (C) and phase (V-pha.) (D) images for the as-prepared nanodot sample. (E and F) Lateral PFM amplitude (L-amp.) (E) and phase (L-pha.) (F) images. Some single nanodot PFM images are zoomed-in and shown in the insets in the gap between (C) and (D) and (E) and (F), illustrating some typical PFM contrast variants frequently observed in the nanodots. The inset schematic diagram of the cantilever indicates that the cantilever is parallel to the y axis (<010> direction); thus, the contrasts in the lateral PFM image reflect the x components of polarization vectors (along the <100> direction). All the PFM images (C to F) are from the same region.
