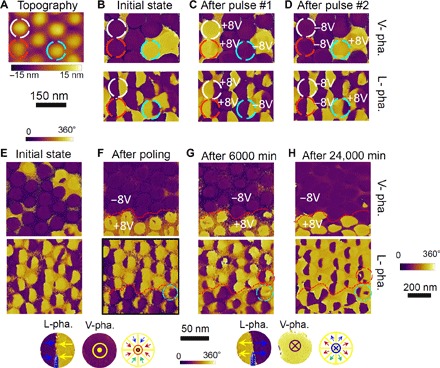
Fig. 4. Electric switching behaviors and retention properties for an array of center domains.

(A to D) The topology and PFM images for a nanodot array illustrating the reversible switching of center domains triggered by applying pulsed electric fields on individual dots, including the topological image (A) and the PFM vertical (top) and lateral (bottom) phase images at the initial state (B), after the first set of electric pulses (C), and after the second set of electric pulses (D). (E to H) PFM images showing the electric switching of center domains by scanning electric bias and the retention properties for the switched center domains, for the initial state (E), the just switching state (F), after a retention duration of 6000 min (G), and after an elongated retention duration of 24,000 min (H). The circles in (G) and (H) indicate the contrast changes in certain nanodots during the retention test. The insets below the panels illustrate the characteristic contrasts in the L-pha. and V-pha. images for center-convergent (left) and center-divergent (right) domains, respectively. PFM images (A) to (E) share the same scale and color bars, and PFM images (F) to (H) share the same scale and color bars.
