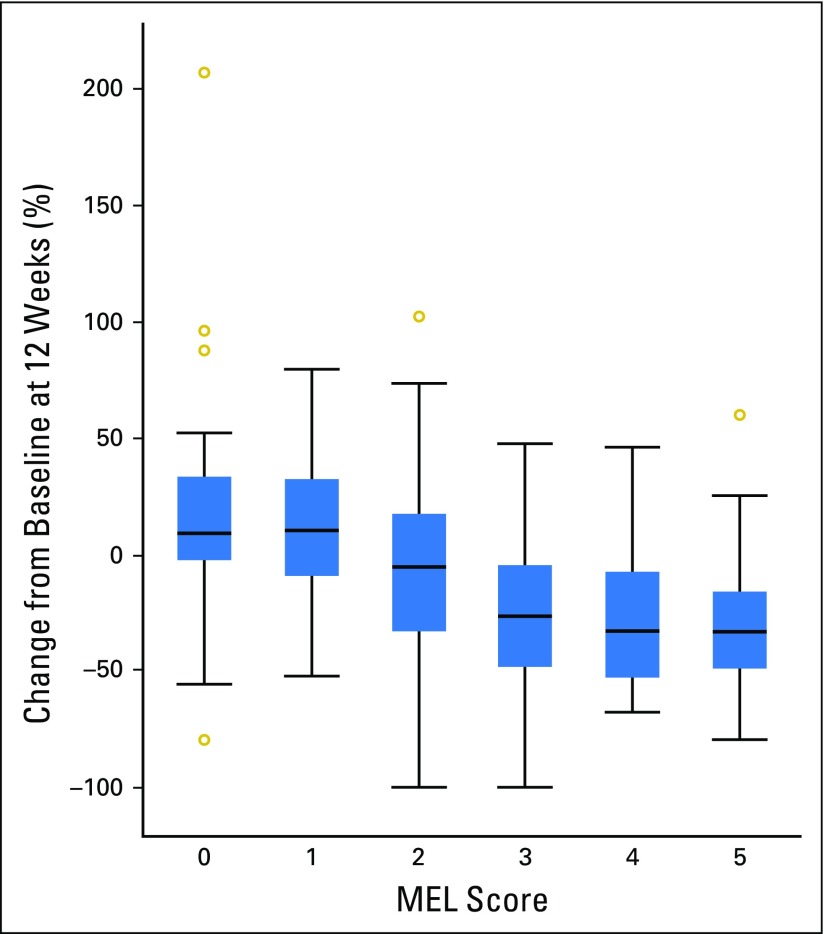
Fig 3.
Box plots of observed percentage change from baseline in tumor size at week 12 by melanoma (MEL) score. The analysis population was patients with evaluable programmed death-ligand 1 (PD-L1) expression who had tumor size data at week 12 (n = 292). MEL score, 0 (0% staining); MEL score, 1 (> 0% to < 1% staining); MEL score, 2 (≥ 1% to < 10% staining); MEL score, 3 (≥ 10% to < 33% staining); MEL score, 4 (≥ 33% to < 66% staining); and MEL score, 5 (≥ 66% to 100% staining). MEL score ≥ 2 is considered PD-L1 positive. Outer boundaries of boxes represent the 1st and 3rd quartiles, and lines in between represent the median.

