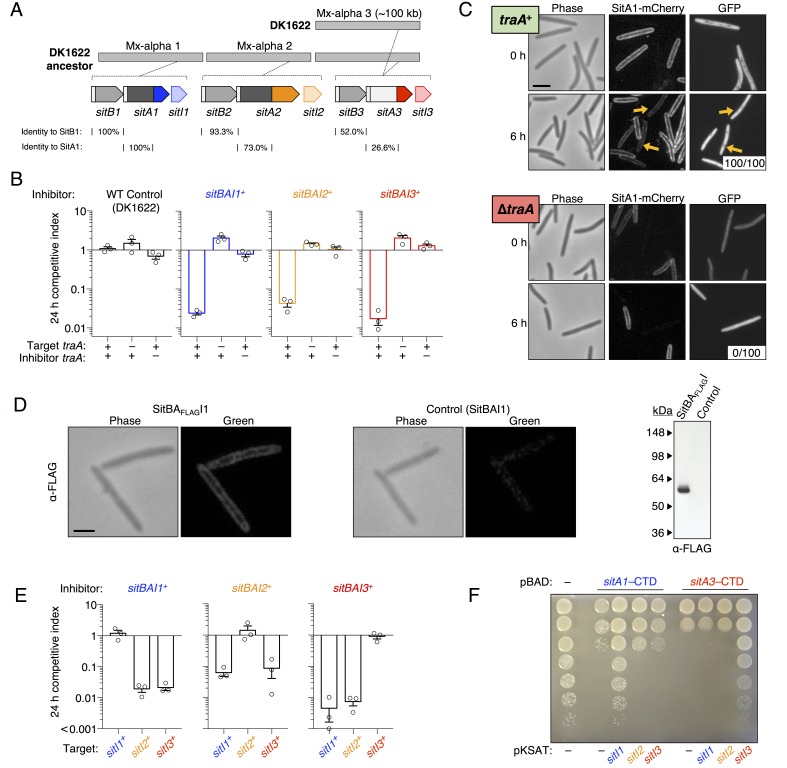
Figure 2. SitA polymorphic toxins found on Mx-alpha units are delivered by OME.
(A) Strain DK101 (the ancestor of DK1622) carries three Mx-alpha repeats, whereas DK1622 retains only one copy. Each Mx-alpha unit contains a unique sitBAI cassette. SitB proteins contain type I signal sequences (white boxes) whereas SitA proteins contain type II signal sequences (white boxes) with a lipobox and C-terminal toxin domains. The relative sequence identities are shown. (B) Competition outcomes when inhibitor strains each expressing one of three sitBAI cassettes were competed against susceptible target strains that lack the corresponding sitBAI cassette. Mock-inhibitor control is shown at left (WT vs. WT). See text for the calculation of competitive index. Strain genotypes (‘–’, traA deletion) are shown below histograms and further strain details provided in Supplementary file 2A. (C) Cells harvested from an agar co-culture of a strain expressing a SitA1-mCherry fusion with a GFP-labeled target at 0 and 6 hr. GFP targets are traA+ in the top panel and ∆traA in the bottom panel. Yellow arrows indicate two examples of GFP cells that have acquired the mCherry reporter. Boxes represent the number of mCherry positive GFP cells out of 100. Bar, 5 μm. (D) Fixed-cell immunofluorescence of C-terminal FLAG-tagged SitA1 and untagged control. Bar, 2.5 μm. Immunoblot of protein isolated from the same strains (right). SitAFLAG predicted size is 62.6 kDa. (E) Competition outcomes when inhibitor expresses one of the three sitBAI cassettes and the target strains express one of the three sitI genes. Data points at <0.001 indicate that no target cells remained. (F) E. coli MG1655 plating efficacy when equal number of cells were 10-fold serially diluted, spotted onto arabinose-supplemented agar and incubated overnight. Strains express either SitA1 or SitA3 C-terminal toxin domain (CTD) from a pBAD plasmid either in the absence (‘–’, empty vector) or presence of the indicated sitI genes expressed constitutively from a separate plasmid (pKSAT). This image is representative of three biological replicates. In this figure and the figures below, error bars represent standard error of the mean from at least three independent experiments.


