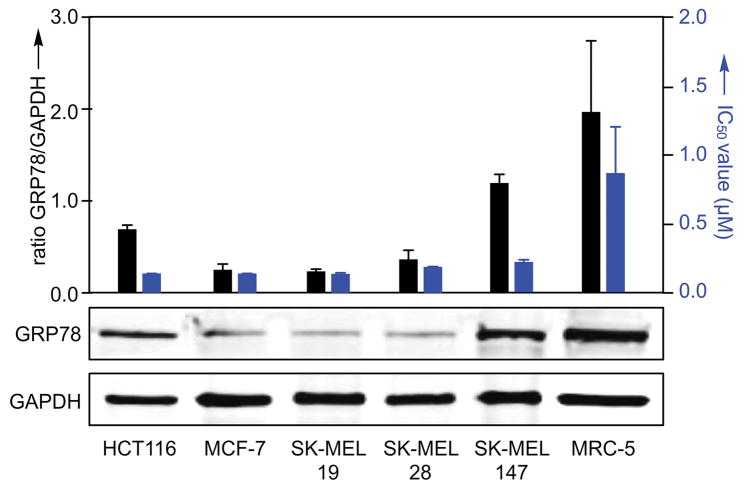
Figure 7.
GRP78 expression correlates with cytotoxicity data. IC50 values (blue) for ritterostatin GN1N (3) in select cell lines after 72 h of treatment with the corresponding levels of GRP78 (black) observed in the cell lines as determined by Western blot analysis using antibodies against GRP78 (3177, Cell Signaling) and GAPDH (5174, Cell Signaling) as a loading control. IC50 values were collected using the MTT assay (see Supporting Information).

