
Figure 4.
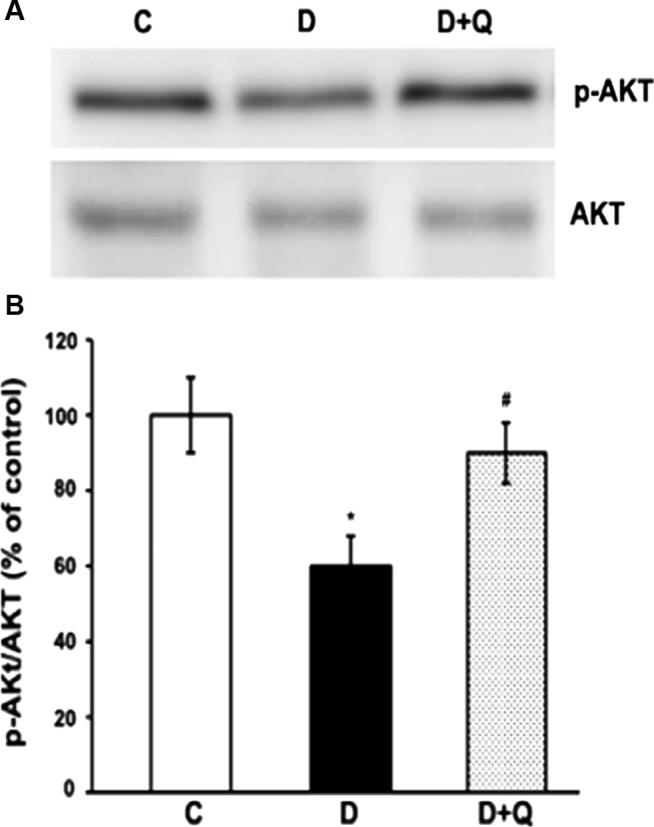
Western blot analysis of the expression of p-Akt and Akt in retinas from control, diabetic, and quercetin-treated diabetic rats. The intensities of the bands were quantified by densitometry. Panel A; Representative immunoblots of p-Akt and Akt, bands. Panel B; Data presented as percent of control of band intensities ratios of those protein bands to Akt. Values are means ± SEM for six determinations. ∗P < 0.01, significantly different from their controls; #P < 0.05, significantly different from diabetic. Experiments were repeated twice.