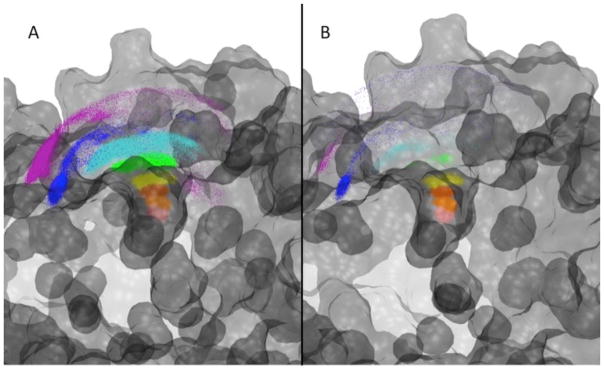
Figure 3.
Panel A: The equilibrium distribution of the center of mass of benzamidine generated along all of the milestones from 2 Å (red) to 12 Å (green) at the end of the umbrella sampling. No umbrella sampling is performed for the BD stages, so there are no points representing the 14 Å milestone. Panel B: The FHPD of benzamidine centers of mass generated from the equilibrium distribution that succeeded in the reverse stage. The milestones between 1 Å (red) and 12 Å (green) were generated during the MD simulations. In addition, the blue distribution at 14 Å represents the FHPD obtained from the BD simulation. This FHPD is used to start forward stage trajectories for generating milestoning statistics.

