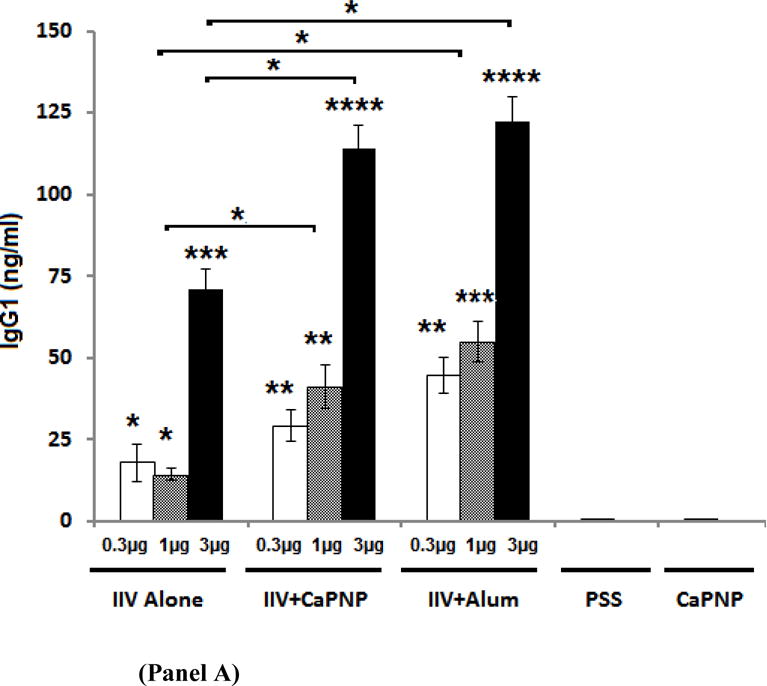
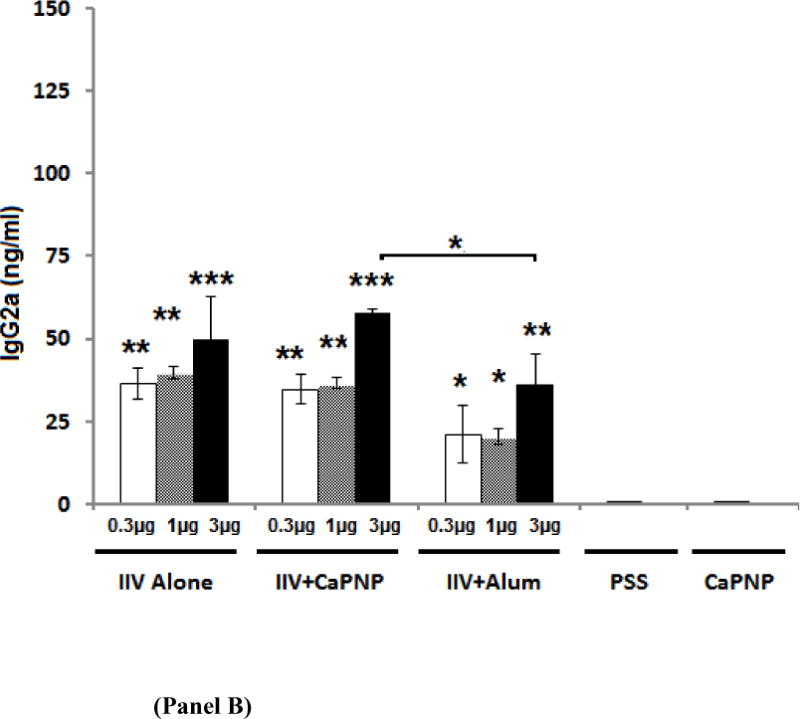
Figure 1. Virus-specific serum antibody response as measured by ELISA.


IgG1 (Panel A) and IgG2a levels (Panel B) are shown in serum from mice on day 21 following i.m. vaccination with an inactivated influenza virus (IIV) vaccine containing CaPNP or Alhydrogel (alum) as adjuvant. Data reported for IgG1 include 10 mice/group, IgG2a includes 5 mice/group. On top of the bars, “*” represent a significant increase (*P<0.05, **P<0.01, ***P<0.001, and ****P<0.0001) compared to saline (PSS) and CaPNP only controls (placebos) in 1-way ANOVA/Turkey test. Significant differences (*P<0.05) between groups are linked by brackets.
