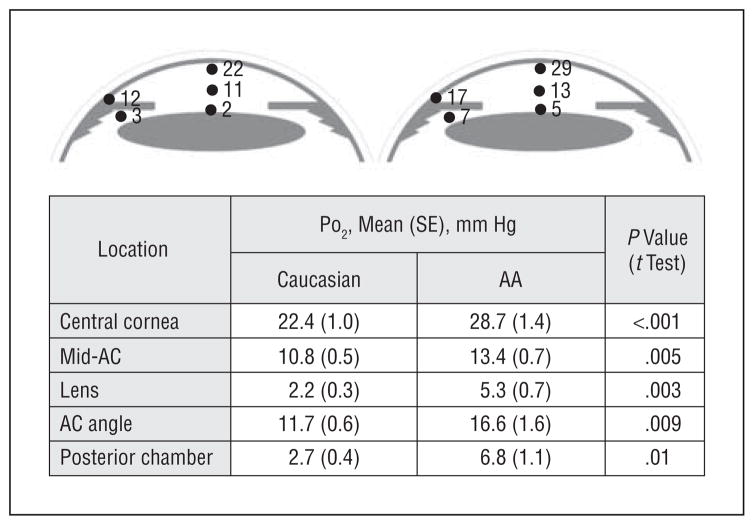
Figure 2.
Diagram of PO2 at 5 location in the eye (see Figure 1). Measured values are shown next to those locations in the illustration. The table provides the mean (SE) and statistical significance of the differences in PO2 between Caucasian and African American (AA) participants, unadjusted for race or age. All differences were statistically significant. AC indicates anterior chamber.

