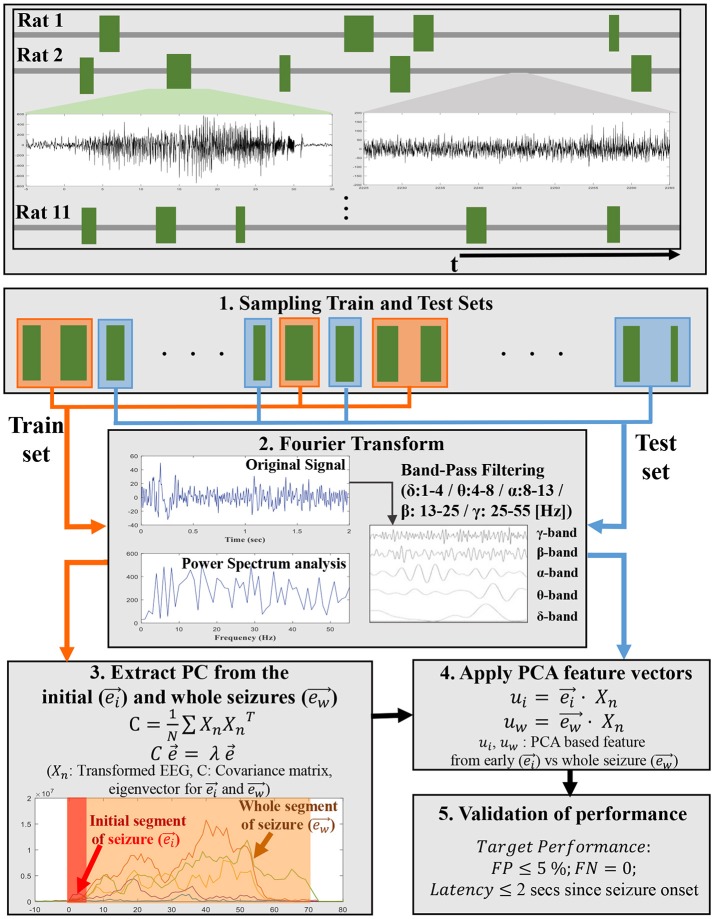
Figure 1.
A schematic flowchart shows an overview of the steps involved in developing PCA-based EEG features in each subband energy from ictal EEGs in training set and application for early seizure detection to ictal EEG segments in test set. The top panel shows ictal EEGs trains for 11 pilocarpine-induced epileptic rats. The mid-left plot in the top panel represents seizure signal and the mid-right plot in the same panel represents non-seizure signal. The random samplings for Train and Test sets are displayed by orange and blue line. In step 3 and step 4, and represent principal component (PC) vector extracted from initial segment of seizures and whole seizures, respectively.

