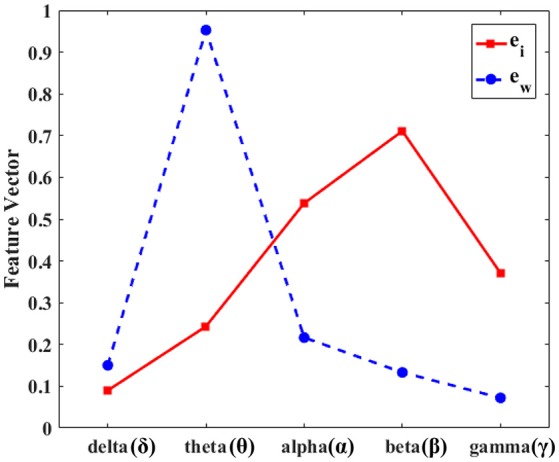
Figure 3.

Dominant eigenvectors from the initial segment vs. the whole seizure segment. The dominant eigenvector from the principal component analysis for the initial 5 s after the seizure onset () vs. the whole segment () of seizures. The y-axis represents the normalized values of the dominant eigenvectors and the x-axis denotes the five subbands. The red line is the eigenvector of the initial 5 s and the blue dashed line represents the eigenvector of the whole seizure segment. The beta frequency band is dominant in the initial segment of seizure (red line), while the theta frequency is strong during the whole seizure segment (blue dashed line). The two feature vectors, and , show quite different tendencies.
