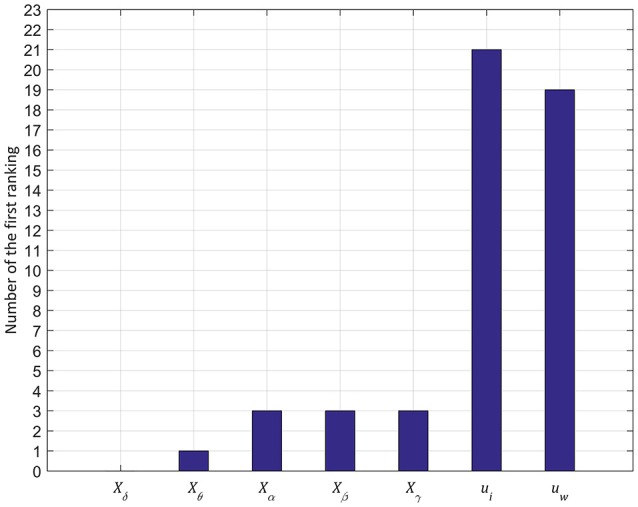
Figure 7.

Number of first ranking in 50 testing seizures. The y-axis represents the number of first rankings among the 50 testing seizures and the x-axis denotes the seven features. Similar to the result of the average of the rank in Figure 6, the principal component from the initial segment of seizures, ui, performs the best ranking among all the seven features with relatively low FP and Lat.
