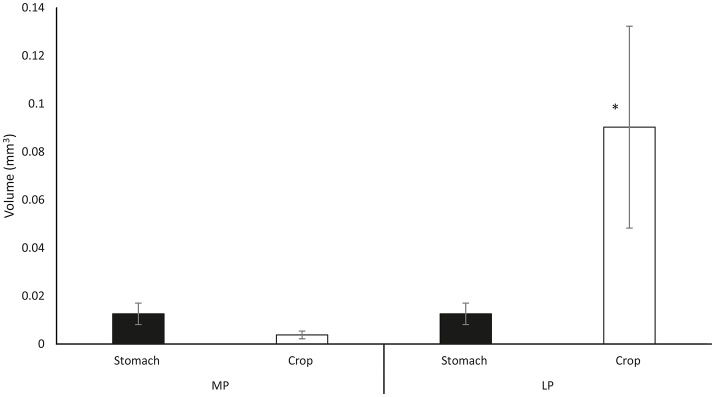
Figure 4.
Mean crop volume (open bars) and stomach volume (filled bars) as combining data from all ingested prey types. MP measurements taken at maximum stomach volume during middle phase; LP volume measurements taken in the late ingestion phase at maximum crop volume (Note that there is no change in the gastric volume). Data plotted as mean ± SD (n = 55). The asterisk (*) indicates significant differences between ingestion phases (MP vs. LP) within organ (ANOVA-RM, p < 0.05).

