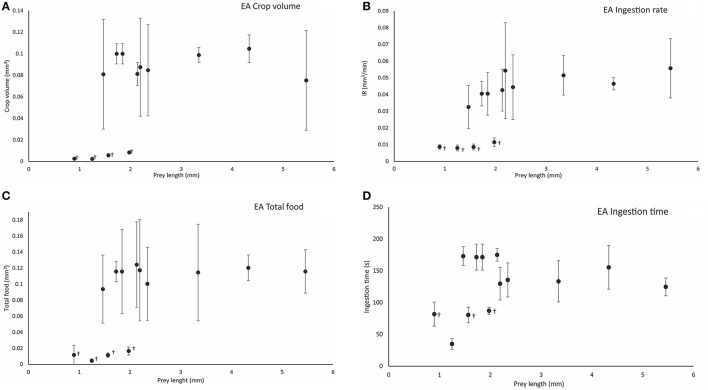
Figure 5.
Calculated crop volume (Cv mm3) (A), ingestion rate (IR, mm3/min) (B), total food volume (TF, mm3) (C), and ingestion time (IT, s) (D), in relation to prey length (mm) following effective attacks (EA) on different prey types. Symbol (†) indicates significant differences (one-way ANOVA, p < 0.05) between prey types at the end of ingestion. Vertical bars represent the standard deviation of the mean of the variable (see the main text for definitions and details).

