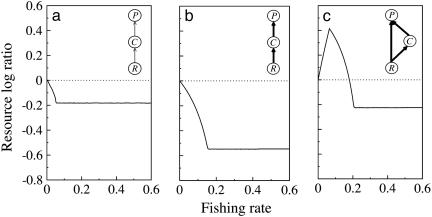
Fig. 3.
Response of the resource as a function of the fraction of predators fished in TFCs with two weak interactions (a), two strong interactions (b), and food chains with omnivory and three strong interactions (c), based on a bioenergetic model (see Materials and Methods). The magnitude of the trophic cascade (measured as the resource log ratio) is greater for food chains with two strong interactions (compare a with b), and it is reduced when there is a similarly strong omnivory link (compare b with c). The dotted line is used as a reference. Parameter combinations are specified in Materials and Methods.

