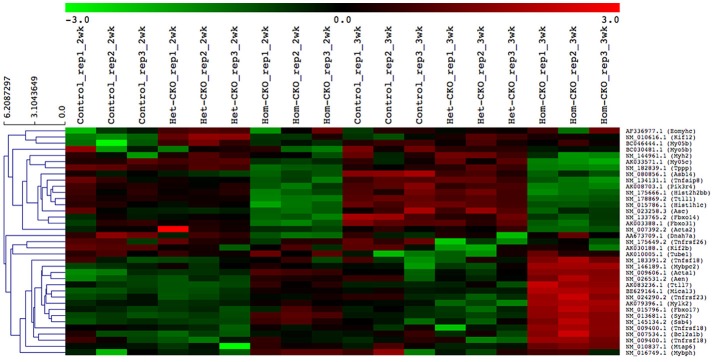
Figure 2.
Heatmap/hierarchical clustering of DEGs of seven different pathways. All replicates of each group (Control, Het-CKO and Hom–CKO) are shown. Similarity between clusters is shown through dendrograms. Vertical dendrograms represent expression values from microarray data. Green and red indicate low and high levels of transcript abundance, respectively.

