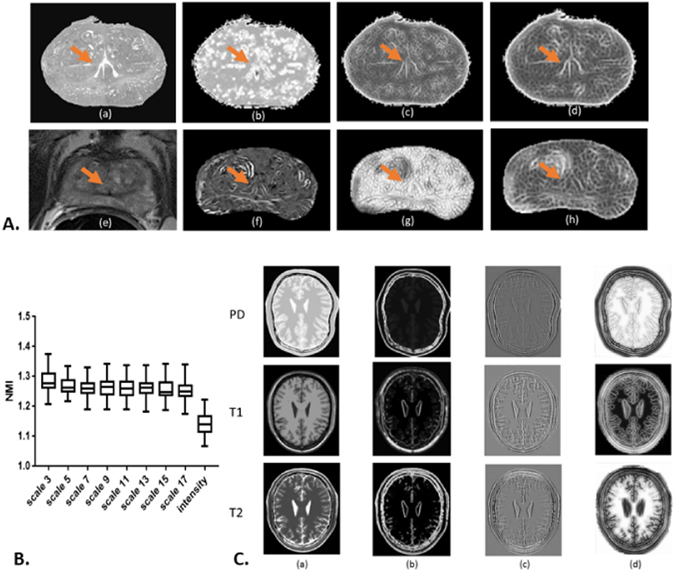
Figure 3.

In Figure 3 Panel A, sub-panel (a) shows the down-sampled gray scale histopathology image and (e) shows the corresponding T2 weighted MRI slice. (b–d) are SE based representations of histopathology and (f–h) are MRI derived SE representations at scales κ ∈ {3, 11, 17}, respectively. The orange arrows point to the urethra structures. Panel B illustrates the NMI distribution for each scale representation across 45 pairs of histopathology images and MRI. Marked improvement in similarity is observed across all scales and reflected via a greater NMI of SE representations compared to intensity - based representations. In Panel C, column (a) shows the intensity representation of corresponding PD, T1 and T2 MRI and columns (b–d) show their corresponding SE representations at scales κ ∈ {3, 9, 17}, respectively. SE representations across different scales emphasize different attributes in the image, attributes that only become apparent at specific length scales. For instance, for clinical data, the region corresponding to the urethra is de-emphasized in the representations shown in (b) and (g). On the other hand, (c), (d), (f) and (h) highlight and emphasize the same regions. In addition, synthetic data SE representations in Panel C, sub-panel (c) illustrate underlying similarities across different modalities compared to sub-panels (a), (b) and (d).
