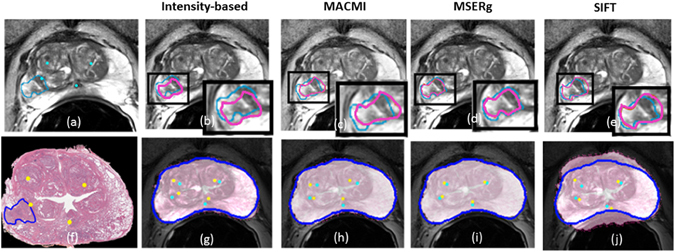
Figure 6.

Illustration of a clinical registration case. (a), (f) are the fixed and moving images with landmarks annotated by the pathologist and the radiologist. The tumor ROI annotations on the pathology image are made by the pathologist and the corresponding tumor ROI on the MRI are mapped from pathology annotations obtained via manual registration. (b), (g) show the registration results of intensity-based registration; (c), (h) of MACMI, (d), (i) of MSERg and (e), (j) of SIFT, respectively. The light blue lines in panels (b–e) illustrate the tumor ROI on a T2-weighted MRI slice and the magenta lines highlight the corresponding ROI on the transformed pathology image. (g–j) illustrate the landmark alignment results where the cyan colored landmarks represent those identified on the MRI, while the yellow colored landmarks represent those corresponding locations on the transformed pathology image. The dark blue lines in (g–j) illustrate the capsule boundary on MRI.
