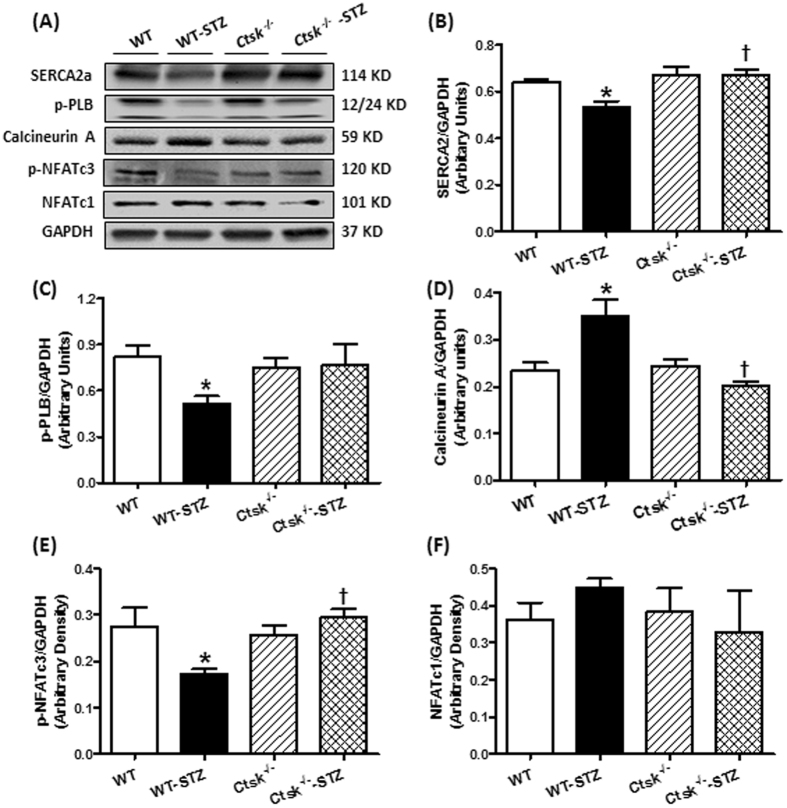
Figure 5.
Western blot analysis exhibiting levels of Ca2+ regulatory proteins as well as calcineurin A-NFAT signaling in myocardium from WT and Ctsk −/− mice treated with or without streptozotocin. (A) Representative gel blots of SERCA2a, phosphorylation of phospholamban (p-PLB), calcineurin A, phosphorylation of NFATc3, NFATc1 and GAPDH (loading control) using specific antibodies; (B) SERCA2a/GAPDH; (C) p-PLB/GAPDH; (D) calcineurin A/GAPDH; (E) p-NFATc3/GAPDH; (F) NFATc1/GAPDH. Mean ± SEM, n = 6 to 7 mice per group. *p < 0.05 vs. WT group, †p < 0.05 vs. WT-STZ group.

