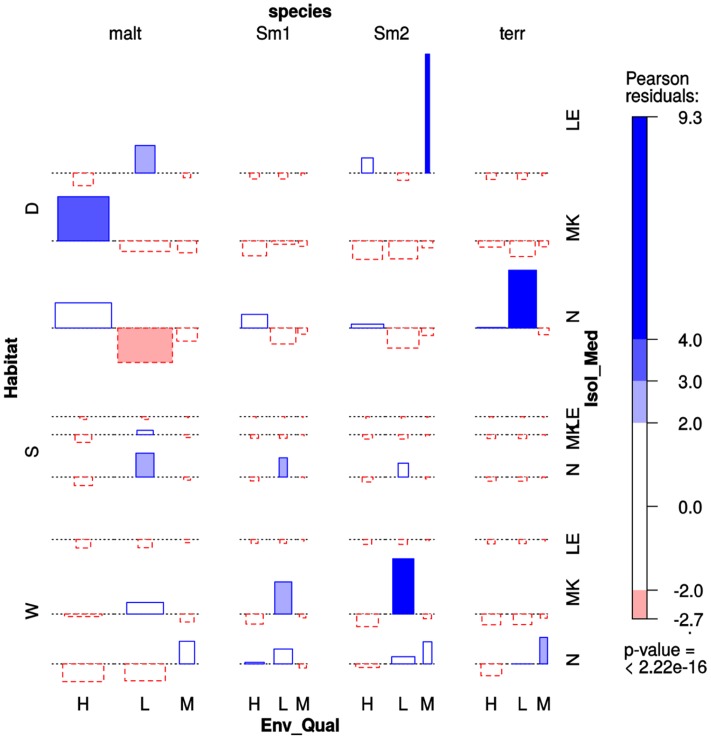
FIGURE 6.
Four-way association plot showing the results of multiway-chi-square analysis for the categorical variables species (abbreviations as defined in Figure 3), habitat (W = water column; S = flooded soil; D = sediment), isolation medium (N = NAA; MK = MacConkey; LE = Leed’s Medium) and pollution level (H = high; L = low; M = intermediate, based on counts of thermotolerant coliforms and E. coli, as defined in Table 1), using Friendly’s residual coloring scheme to highlight the significant associations. Species codes are as defined in Figure 3. The bars on the plot represent the Pearson residuals, the color code and the height of the bars denote the significance level and magnitude of the residuals, and their widths are proportional to the sample size.

