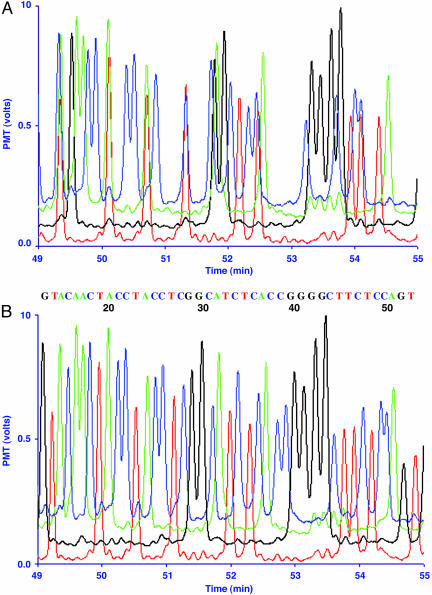
Fig. 5.
Electropherogram of the HNF-1α exon 10 gene region using PME dye–primers. (A) Unprocessed fluorescent data obtained during the electrophoretic run from the PME detector. Blue, green, black, and red traces are AF-405, BODIPY-FL, 6-ROX, and Cy5.5 dye–primers terminated with ddCTP, ddATP, ddGTP, and ddTTP, respectively. Laser powers were 1.4, 1.0, 0.30, and 1.2 mW for the 399-, 488-, 594-, and 685-nm lasers, respectively. Baselines were shifted to space the four laser traces in a nonoverlapping manner. (B) Transformation of the raw trace data derived from the experiment described in A into readable DNA sequence data by using mobility software correction. Base-calling was determined based on the highest fluorescent signals for each fragment peak. The numbers below the DNA sequence correspond to the base number following the PCR primer position.

